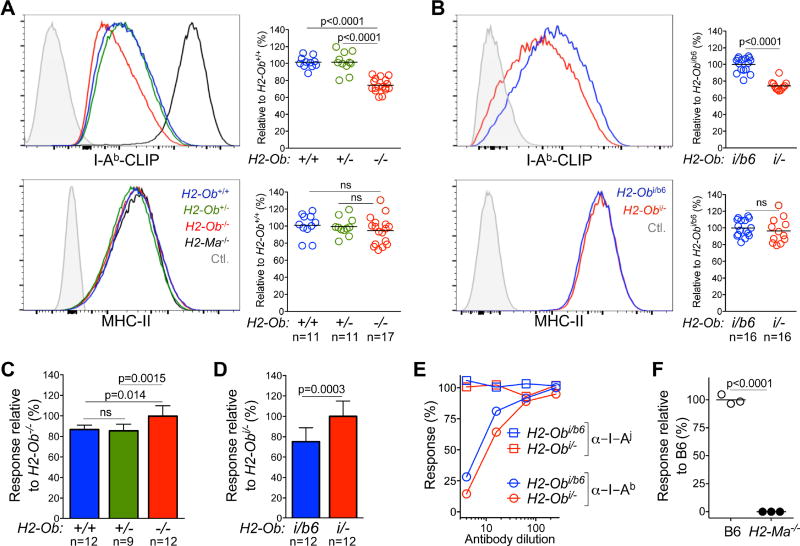
Figure 5. I/LnJ Oβ is functionally null.
(A) and (B), Comparison of MHC-II expression in mice with various H2-Ob genotypes. Representative FACS analysis showing the expression level of I-Ab-CLIP (top) and MHC-II (bottom) on the cell surface of CD19 positive B cells from B6 mice with indicated H2-Ob genotypes (A) or from (I/LnJ × B6) F1 (H2-Obi/b6) and (I/LnJ × B6.H2-Ob−/−) F1 (H2-Obi/−) (B) mice. In (A) I-Ab-CLIP levels for B6.H2-Ma−/− B cells and MHC-II-negative CD8+ T cells were used as positive and negative staining controls (Ctl), respectively; unstained B cells were used as a negative staining control in (B). Graphs show quantification of the geometrical mean fluorescence intensity of I-Ab-CLIP and MHC-II for the indicated strains of mice relative to that obtained for H2-Ob+/+ (A) or H2-Obi/b6 (B) B cells. n, number of mice used in 7 independent experiments.
(C) and (D) Enhanced antigen presentation by B cells expressing I/LnJ Oβ. Antigen presentation by purified B cells from the indicated strains of mice was measured by co-culture with the I-Ab-restricted 8-1-6 T cell line. IL-2 release was measured after overnight incubation by color conversion of Alamar Blue by an IL-2–dependent cell line. Data is presented as response relative to the level of IL-2 produced in response to H2-Ob−/− (C) or Obi/− (D) B cells. n, number of mice used in 5 independent experiments.
(E) The 8-1-6 T cell line is restricted to I-Ab. Activation of I-Ab-restricted 8-1-6 T cell line was measured in the presence of titrated doses of a monoclonal Ab specific for I-Ab (Y3JP) or of a control monoclonal Ab specific for I-Aj (10.2.6).
(F) The 8-1-6 T cell line is activated by a H2-M dependent peptide. IL-2-secretion by 8-1-6 T cell line was measured in response to B6 and B6.H2-Ma−/− splenocytes. Data are representative of 2 similar experiments. Significance was calculated using an unpaired t test. ns, non-significant; n, number of mice.

