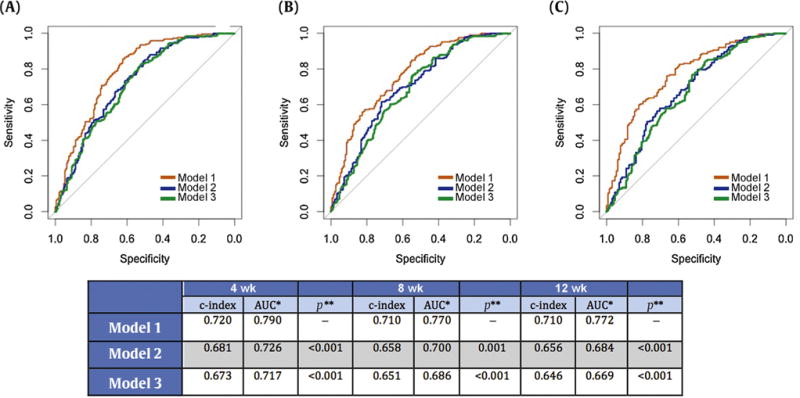
Fig. 1.

Receiver operating characteristic (ROC) curves for three models at (A) 4 wk, (B) 8 wk, and (C) 12 wk. Model 1 comprised CTC response, baseline CTC (log-transformed), baseline LDH (log-transformed), and baseline ECOG status at 4 wk; and CTC response, baseline CTC (log-transformed), and baseline LDH (log-transformed) at 8 and 12 wk. Model 2 comprised baseline CTC (log-transformed), baseline LDH (log-transformed), and baseline ECOG status at 4 wk; and baseline CTC (log-transformed) and baseline LDH (log-transformed) at 8 and 12 wk. Model 3 comprised baseline LDH (log-transformed) and baseline ECOG status at 4 wk; and baseline LDH (log-transformed) at 8 and 12 wk. CTC = circulating tumor cell; LDH = lactate dehydrogenase; ECOG = Eastern Cooperative Oncology Group; AUC = area under the ROC curve.
*Status variable: survival at 11 mo (yes vs no).
**Comparison of two correlated ROC curves (De Long’s rest) with model 1 as the reference model.
