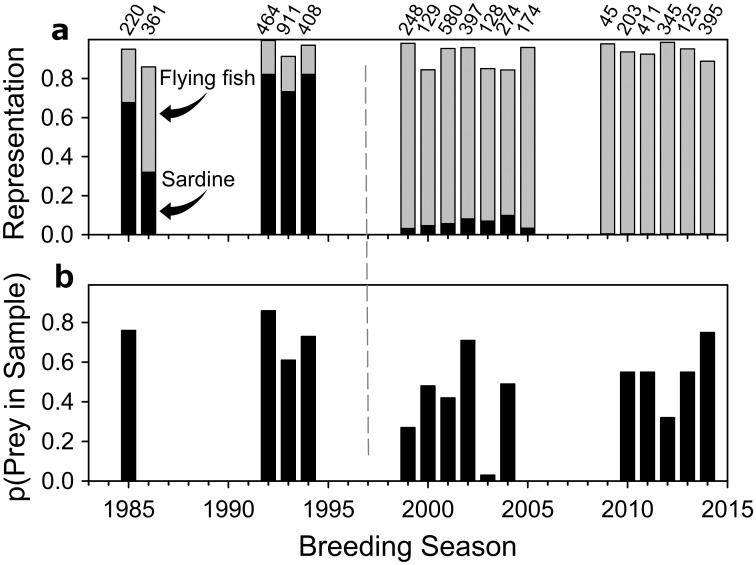
Fig 1. Temporal change in diet of Nazca boobies.
(a) Numerical representation of the two major prey types in systematic and opportunistic regurgitation samples. Missing years due to permit restrictions (mid-2000s) or to lack of data (1980s and mid-1990s; sardines (black fill) dominated casual observations during these gaps until the 1997–98 El Niño event [dashed line] but data not recorded). # prey items at top of bar. Breeding spans two calendar years (October-May), “breeding seasons” are labelled by the first year in each two-year spread. Black and gray bars do not sum to 1.0 because sardines and flying fish are not the only prey types in the diet. (b) Probability of a bird producing at least one prey item in 1,345 systematic regurgitation samples collected in January-April (probability is lower after 1997–98; Mann-Whitney U Test, N1 = 4, N2 = 11, Z = 2.48, P = 0.01; see S1 Methods).

