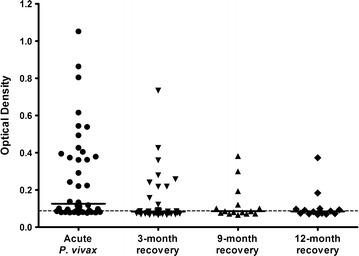
Fig. 2.

The antigenicity of PvGAMA during and post-infection with Plasmodium vivax. The anti-PvGAMA responses were measured in acutely infected individuals (n = 40) and in patients who had been in recovery for 3 months (n = 35), 9 months (n = 15) and 12 months (n = 14) by conventional ELISA assay. Each symbol represents the antibody titre of one individual. The solid line shows the median antibody titre in each group. The dotted line indicates the cut-off values
