Fig. 3.

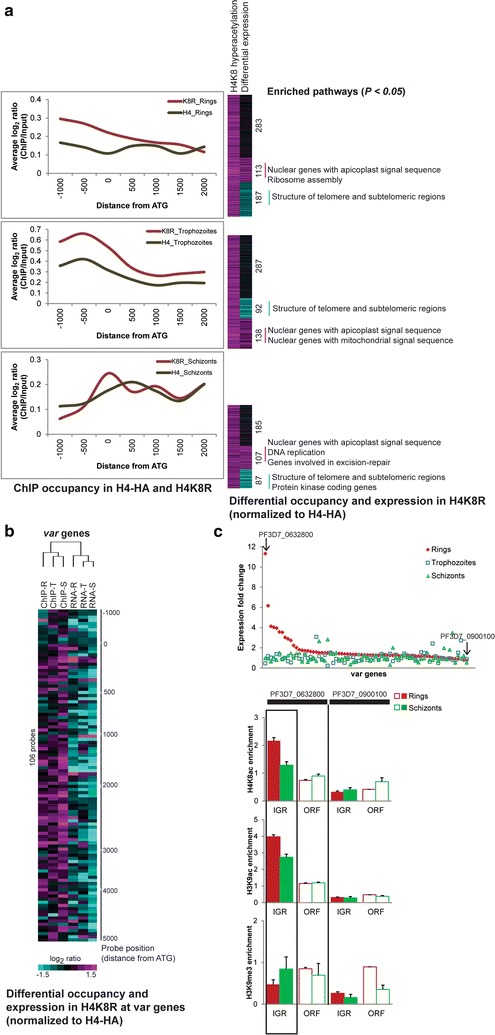
Euchromatin- and heterochromatin-linked H4K8ac. a ChIP-on-chip for H4-HA and H4K8R transfectants using anti-HA antibody. All microarrays were done in triplicates, and differential binding was assessed by Wilcoxon rank sum test (P < 0.05). Graphs on the left show average ChIP/Input log2 ratio of all the probes binned according to their distance from the start codon. Heat maps on right depict the probes with increased binding and change in expression in the corresponding genes in H4K8R transfectants (compared to H4-HA). Functional pathways (MPMP) significantly enriched in the up or downregulated gene sets are shown. b Analysis of var genes linked heterochromatin in H4K8R. Heat map represents the differential binding at var gene loci and differential RNA expression of corresponding genes (H4K8R normalized to H4-HA transfectants). The distance from ATG marked on the right depicts the microarray probe position with respect to gene start. c Histone marks at active/inactive var gene in 3D7 clone. Graph on top represents microarray gene expression values of var genes in one of the 3d7 clones. The highest and least expressed var genes are marked with the arrow. The lower 3 graphs show the ChIP enrichment by qPCR of the most dominantly expressed var gene and the least expressed var gene (input subtracted Ct values normalized to ORF of PF3D7_1240300). Primers were designed within 1000 bp on each side of the gene start. The results of the other 3 clones are shown in Additional file 4: Figure S3
