Fig. 4.

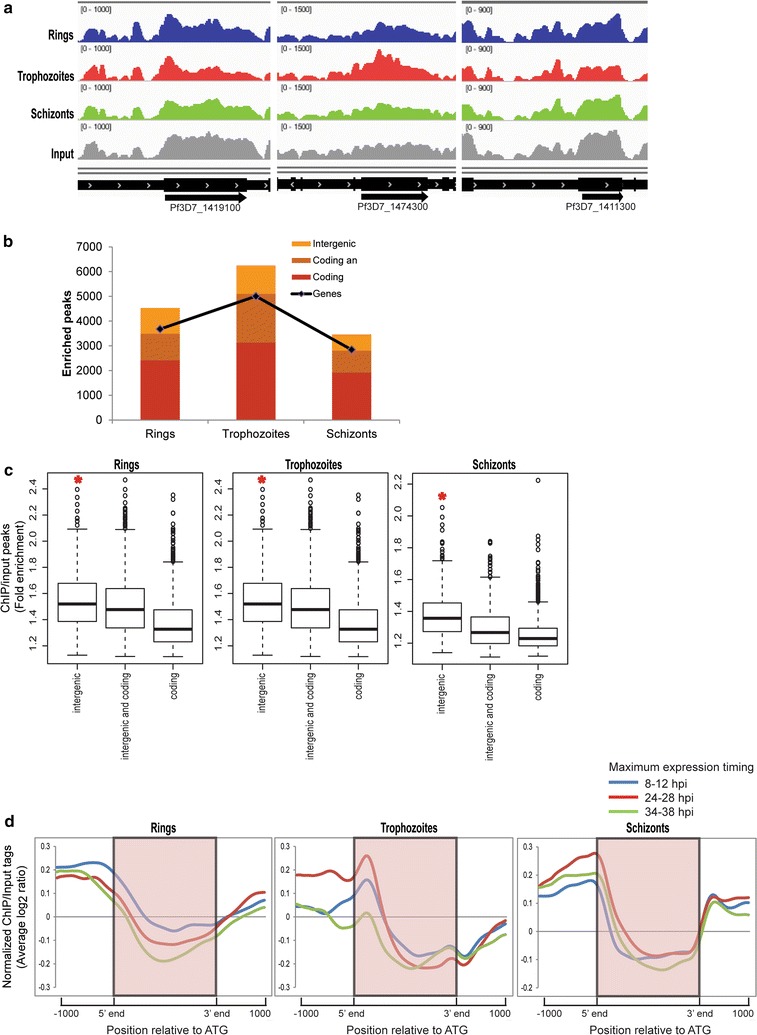
Genome-wide high-throughput ChIP-Seq to identify H4K8ac bound DNA. a A snapshot of the genome browser in Integrative Genomics Viewer showing normalized reads mapped to different regions of chromosome 14 representing one highly expressed gene region (highlighted) from each of the 3 stages. The graphs represent the chip over input ratios shown for gene Pf3D7_1419100, Pf3D7_1474300, Pf3D7_1411300 for rings (blue), trophozoites (red) and schizonts (green). Read coverage for input is shown in gray and the gene coordinate is marked in black. The tracks were normalized to library size such that the height of each track represents mapped read coverage. b Bar graph showing the number of H4K8ac peaks (identified by MACS using a q-value cut-off of 20%). The line (graph) represents number of genes corresponding to the peaks. c Box plots representing enrichment fold change of H4K8ac peaks covering intergenic regions, coding regions or both. The H4K8ac peaks and input peaks were normalized to the total number of reads and ratio of H4K8ac versus input peaks was calculated. *Denotes that IGR occupancy is significantly higher than ORF occupancy (Wilcoxon rank sum test, P < 1e−15). d H4K8ac binding assessed by binning the total normalized read counts (ChIP-normalized read coverage/input-normalized read coverage) into equal number of bins covering 1000-bp upstream, the gene coding body and 1000-bp downstream of each gene. The resulting profiles are plotted for genes with maximum expression at 8–12, 24–28 and 34–38 hpi corresponding to the stage when the cells were harvested for immunoprecipitation
