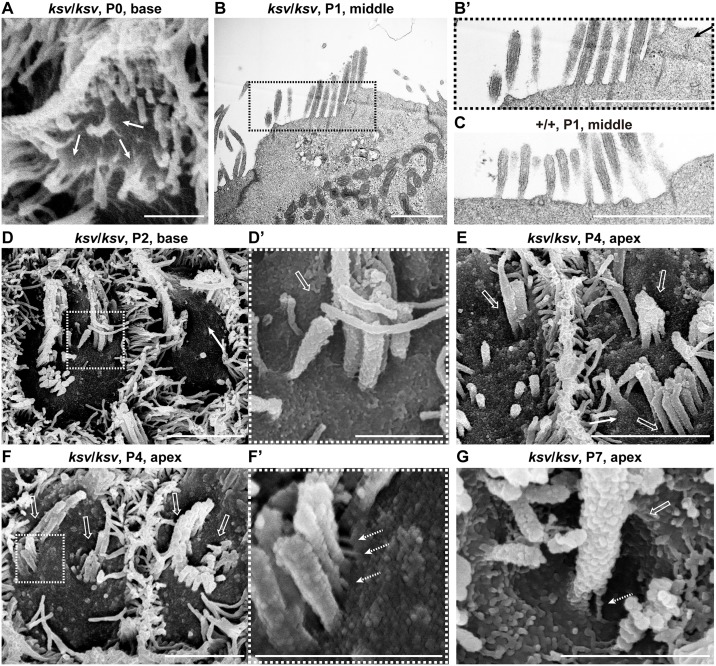
Fig 10. Deformation of the cuticular plate membranes of OHCs of ksv/ksv mice during the process of stereociliary fusion.
A. SEM image showing the raised stereociliary bases in the OHCs from the base area of the cochlea in a ksv/ksv mouse at P0. Arrow indicates the raised membrane of the cuticular plate. B. TEM image showing the apical regions of OHCs from the middle area of the cochlea in a ksv/ksv mouse at P1. Highly magnified image of the stereociliary base shown in B’. C. Highly magnified TEM image showing the stereociliary base in OHCs of a +/+ mouse at P1. D. Typical phenotypes of the apical surfaces of the OHCs from the base area of the cochlea in ksv/ksv mice at P2. Highly magnified image (D’) in the dotted box of D shows the subsidence (open arrow) of the cuticular plate membrane in the stereociliary base. E–G. Phenotypes of the apical surfaces of the OHCs from the apex area of the cochlea in ksv/ksv mice at P4 (E and F) and P7 (G). Open arrows indicate the pocket-like structures of the cuticular plate detected in the bases of the incorporated stereociliary bundles. Highly magnified image (F’) in the dotted box of F shows the connections via links (dotted arrows) between the stereocilia and the cuticular plate membrane detected in the OHCs. Scale bars = 3 μm (D, E and F), and 1 μm (A–C, D’, F’ and G).

