
Fig. 3.
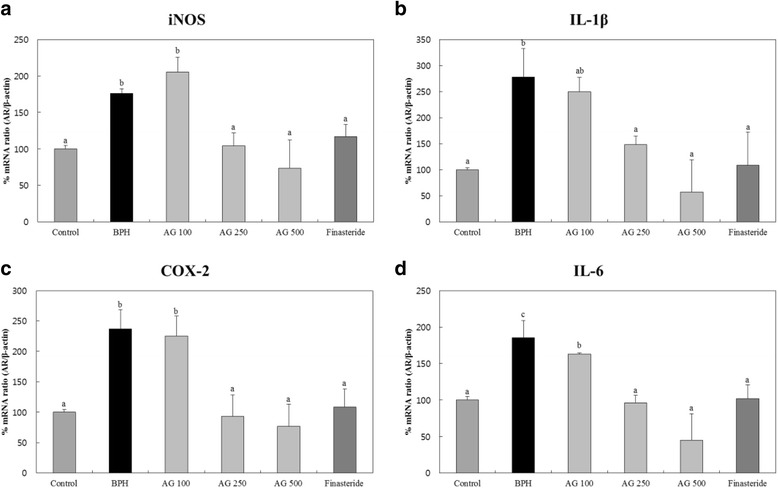
Effects of AG on expression of Inflammation-related gene’s mRNA in the prostate (a) iNOS (b) IL-1β (c) COX-2 (d) IL-6. Control: water, BPH: 3 mg/kg testosterone propionate, AG 100, AG 250, AG 500: 3 mg/kg testosterone propionate + AG 100 mg/kg, AG 250 mg/kg, AG 500 mg/kg, respectively, Finasteride: 3 mg.kg testosterone propionate + finasteride 10 mg/kg. Data represented as mean ± SD (n = 7). Significant difference at p < 0.05 compared with the Control group and BPH induced group, respectively