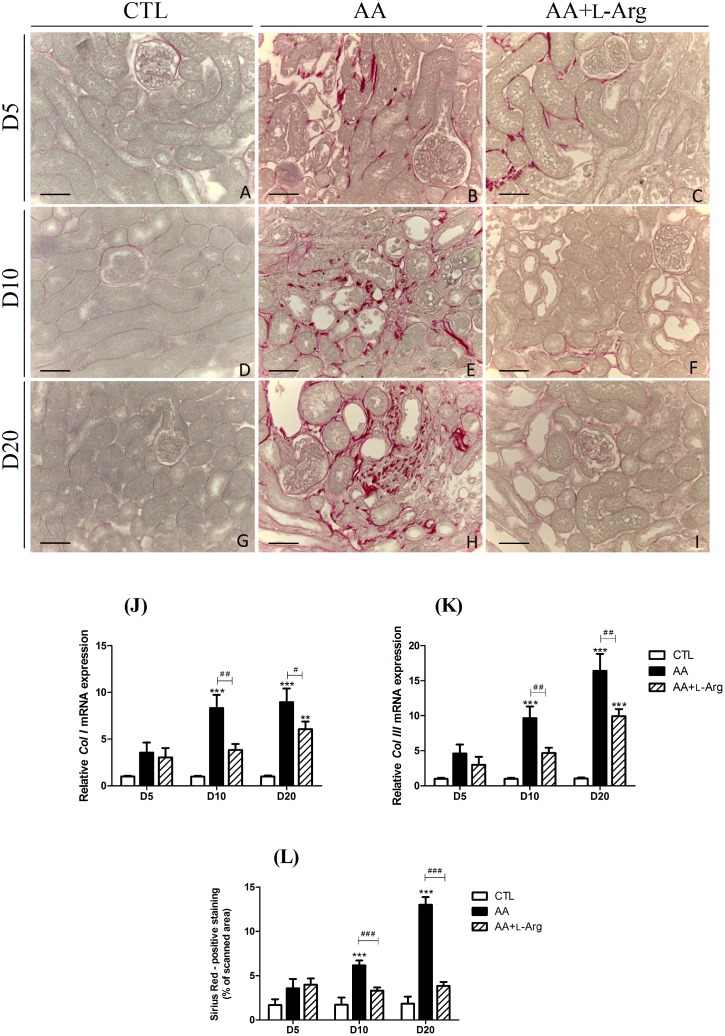
Fig 4. Effect of L-arginine supplementation on Sirius Red staining at days 5, 10 and 20 in CTL, AA and AA+L-Arg mice.
Representative photographs of picrosirius red stained kidney sections (x400) from CTL (A,D,G), AA (B,E,H) and AA+L-Arg (C,F,I) mice at days 5, 10 and 20. Scale bar = 50 μm. Real-time quantitative PCR for ColI (J) and ColIII (K) mRNA expression was performed with kidney tissue from CTL, AA and AA+L-Arg mice normalized against 18S Quantitative analysis of picrosirius red expression in CTL, AA and AA+L-Arg mice at days 5, 10 and 20 (L). Statistical analysis was performed using two-way ANOVA followed by Holm-Sidak test. Data are presented as means ± SEM; n = 8 in each group. **P ≤ 0,01 vs CTL mice, ***P ≤ 0,001 vs CTL mice, #P ≤ 0,05 vs AA mice, ##P ≤ 0,01 vs AA mice and ###P ≤ 0,001 vs AA mice.

