
Fig. 1.
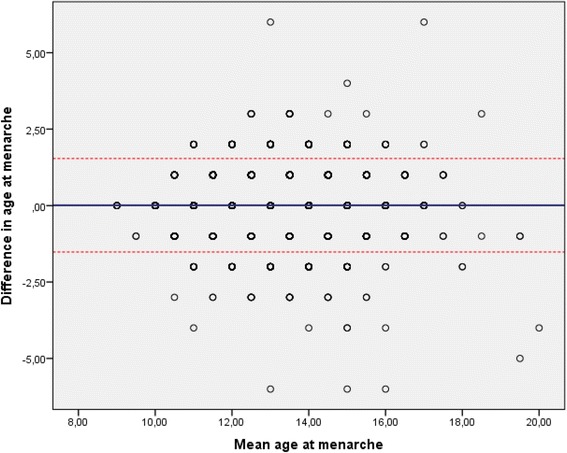
Bland-Altman plot of the agreement in self-reported age at menarche among 6731 women who attended both Tromsø 3 (1986–87) and Tromsø 4 (1994–95). The Tromsø Study. The red dotted lines present the limits of agreement; −1.52 – 1.54 years, the thick blue line in the middle represents the mean difference between reported age at menarche in Tromsø 3 and Tromsø 4. Note that one dot may represent many observations