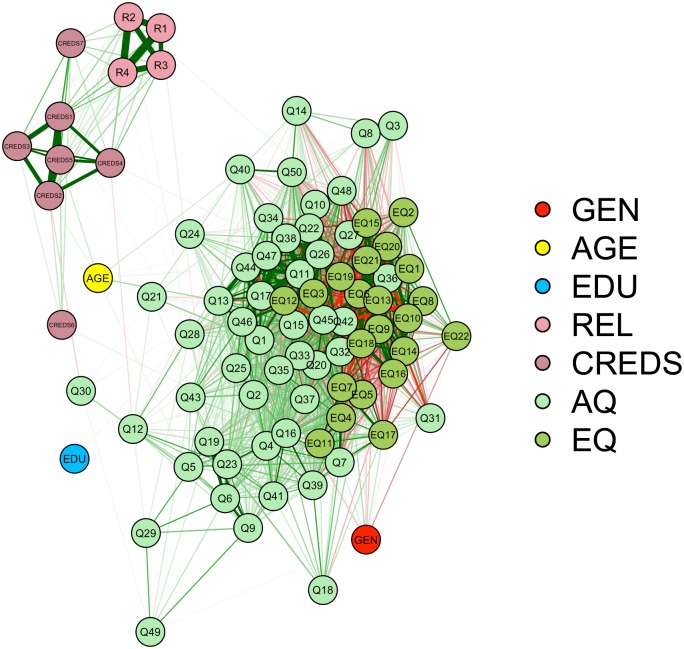
Fig 2. Network analysis entailing a graphical representation of the inter-item correlations among all items used in Study 2.
GEN = Gender, AGE = Age, EDU = Education, REL = religiosity, CREDS = Credibility Enhancing Display Scale, AQ = Autism Spectrum Quotient, EQ = Shortened Empathy Quotient, R1 = God, R2 = praying, R3 = Church, R4 = religiosity, CREDS1 –CREDS 7 = item 1–7 of the own-constructed Credibility Enhancing Display Scale, Q1 –Q50 = item 1–50 of the Autism Spectrum Quotient. The lines represent the inter-item correlations. Thicker lines represent larger correlations and correlations were thresholded at r = .15. Green lines are indicative of positive correlations, red lines of negative correlations.

