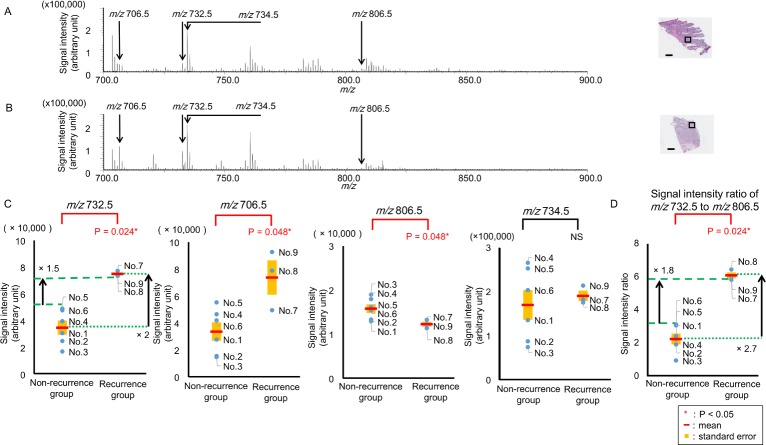
Fig 1. Comparison of averaged signal intensities between non-recurrence and recurrence groups.
(A) Averaged mass spectrum obtained from the cancer epithelial area of the non-recurrence case (No. 1). (B) Averaged mass spectrum from the cancer epithelial area of the recurrence case (No. 9). Regions of interest set in cancer epithelial areas are presented as black squares in the hematoxylin and eosin -stained images, Scale bar = 1000 μm. (C) Averaged signal intensities of m/z 732.5 and 706.5 in the recurrence group (n = 3) were significantly higher than those in the non-recurrence group (n = 6, P = 0.024* and 0.048*, respectively). Averaged signal intensity of m/z 806.5 in the recurrence group (n = 3) was significantly lower than that in the non- recurrence group (n = 6, P = 0.048*) No significant differences occurred between the two groups related to the signal intensity at m/z 734.5 (P >0.5). The mean value of the averaged signal intensity at m/z 732.5 in the recurrence group was two times higher than that in the non-recurrence group. The lowest averaged signal intensity at m/z 732.5 in the recurrence group (No. 8) was 1.5 times higher than the highest in the non-recurrence group (No. 5). (D) Compared with the non-recurrence group, the ratio of the signal intensity of m/z 732.5 to that of m/z 806.5 was significantly higher in the recurrence group (P = 0.024*).* The mean value of the ratio of the signal intensity at m/z 732.5 to that at m/z 806.5 in the recurrence group was 2.7 times higher than that in the non-recurrence group. The highest ratio of the signal intensity at m/z 732.5 to that at m/z 806.5 in the recurrence group (No. 7) was 1.8 times higher than the lowest in the non-recurrence group (No. 6). P < 0.05. NS: not statistically significant.

