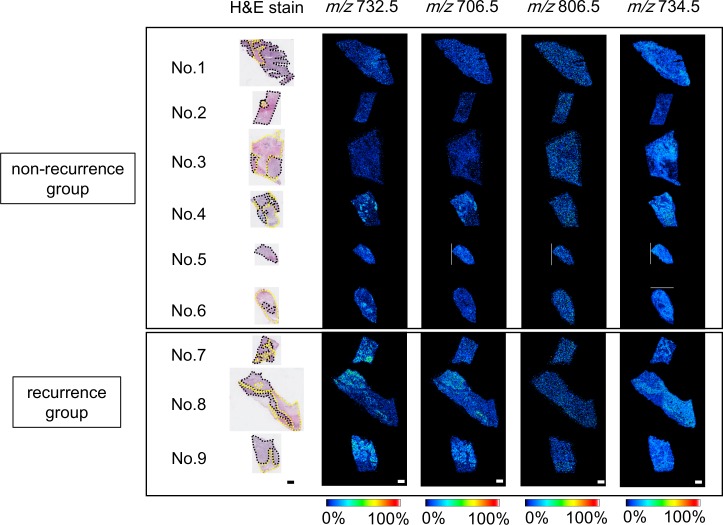
Fig 2. Ion distributions of non-recurrence and recurrence groups.
Characteristic distributions of ions are shown in samples of non-recurrence (upper) and recurrence (lower) groups. Regions circled by black and yellow dashed lines represent the cancer epithelial area and surrounding stroma, respectively. Signal intensities at m/z 706.5 and m/z 732.5 in the cancer epithelial area of the recurrence group were higher than those of the non-recurrence group. Both groups showed higher signal intensities at m/z 734.5 in surrounding stroma. Scale bar = 1000 μm. MALDI-IMS: matrix-assisted laser desorption/ionization-imaging mass spectrometry; H&E: hematoxylin and eosin.

