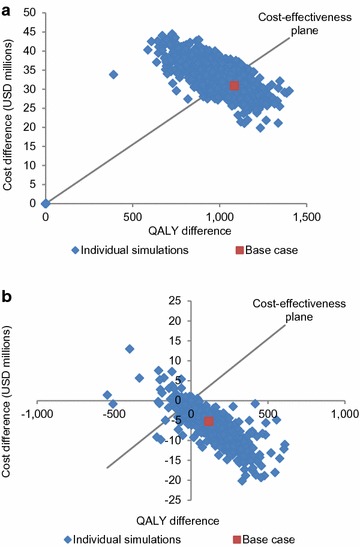
Fig. 3.

PSA results for PHiD-CV 2+1 versus a no vaccination and b PCV13 2+1 vaccination programs. The “cost-effective” threshold was taken to be 3 × GDP per capita. GDP gross domestic product, PCV13 13-valent pneumococcal conjugate vaccine, PHiD-CV pneumococcal polysaccharide and NTHi protein D conjugate vaccine, PSA probabilistic sensitivity analysis, QALY quality-adjusted life-year, USD United States dollars
