
Fig. 4.
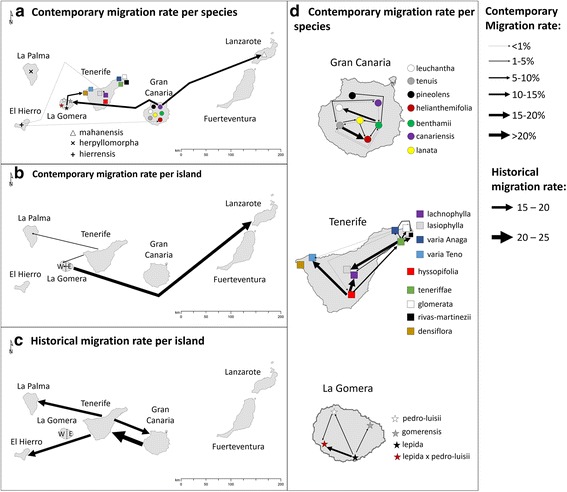
Representation of recent and historical migration rates calculated with BayesAss and Migrate, respectively. All arrows correspond to migration rates with 95% confidence intervals above 0.001 for BayesAss and 0 for Migrate. Arrow thickness is proportional to the migration rate. Panels a and b correspond to contemporary migration rates calculated between islands using species and islands as groups, respectively. Panel c shows historical migration rates between islands groups calculated with Migrate. These were the only significant values obtained from this program. In Panel d. contemporary migration rates between species within islands are shown