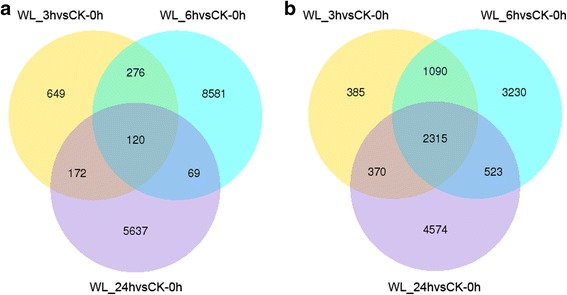
Fig. 10.

Venn diagrams of the differential expression transcripts under different treatment times. The number of DEGs exclusively up- or downregulated in Cerasus sachalinensis roots is shown. The number of DEGs with a common or opposite tendency of expression change between the two waterlogging times is shown in the overlapping regions. a Venn diagrams of the upregulated differential expression transcripts; b Venn diagrams of the downregulated differential expression transcripts
