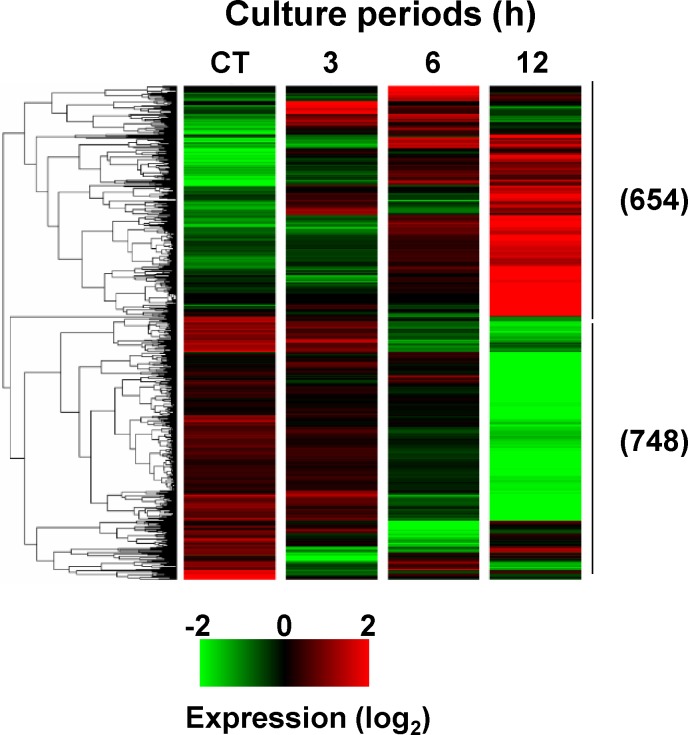
Fig 4. RNA-seq analysis and hierarchical clustering of 1402 transcripts differentially expressed by > 5.0 in U937 cells treated with 3OTPCA.
Strand NGS software was used to perform hierarchical clustering (squared Euclidean distance and Ward’s linkage). Each transcript is represented by a single row of colored bars. Intensity in the green and red color range indicates down-regulated and up-regulated transcripts, respectively. The number in parentheses indicates the number of transcripts.

