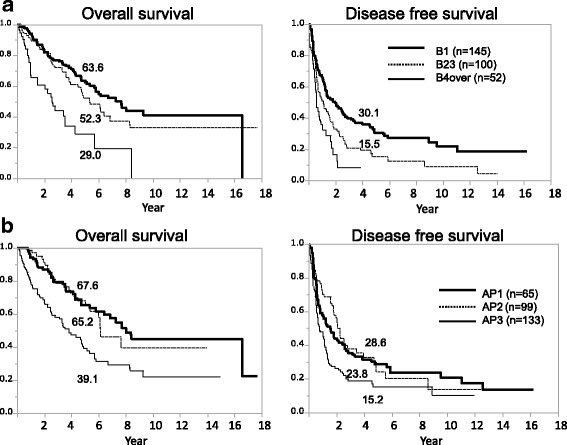
Fig. 1.

Overall survival curves according to tumor number and AP-factor. a The 5-year overall survival rates of B1, B23, and B4over were 63.6, 52.3, and 29.0%, respectively. There was a significant difference between each of these groups (p < 0.01), except for B1 and B23. The 5-year disease-free survival rates of B1 and B23 were 30.1 and 15.5%, respectively (p < 0.01). b The 5-year overall survival rates of AP1, AP2, and AP3 were 67.6, 65.2, and 39.1%, respectively. There was a significant difference between AP1 and AP3 (p < 0.01) and between AP2 and AP3 (p < 0.01). The 5-year disease-free survival rates of AP1, AP2, and AP3 were 23.8, 28.6, and 15.2%, respectively. There was a significant difference between AP1 and AP3 (p < 0.01) and between AP2 and AP3 (p < 0.01)
