
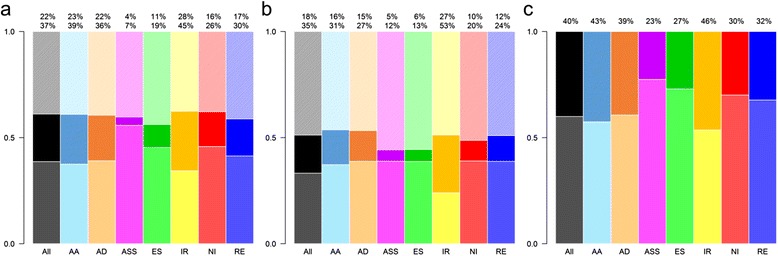
Fig. 6.
Conservation of AS among Phaseolus vulgaris and Glycine max. Cumulative bar plots represent total AS events (black bars) and each AS event type (colored bars). In every bar plot the stripped bar (top) corresponds to AS events in non-homologous genes, the dark tone color bar (middle or top) to conserved AS events and the light tone color bar (bottom) to non-conserved AS events in homologous genes. The numbers over the bar indicate the percentage of conserved events over all AS events (top) and over AS events in homologous genes (bottom). AS event conservation of P. vulgaris in G. max (a), of G. max in P. vulgaris (b) and in paralogous G. max genes, originated by its recent WGD (c)