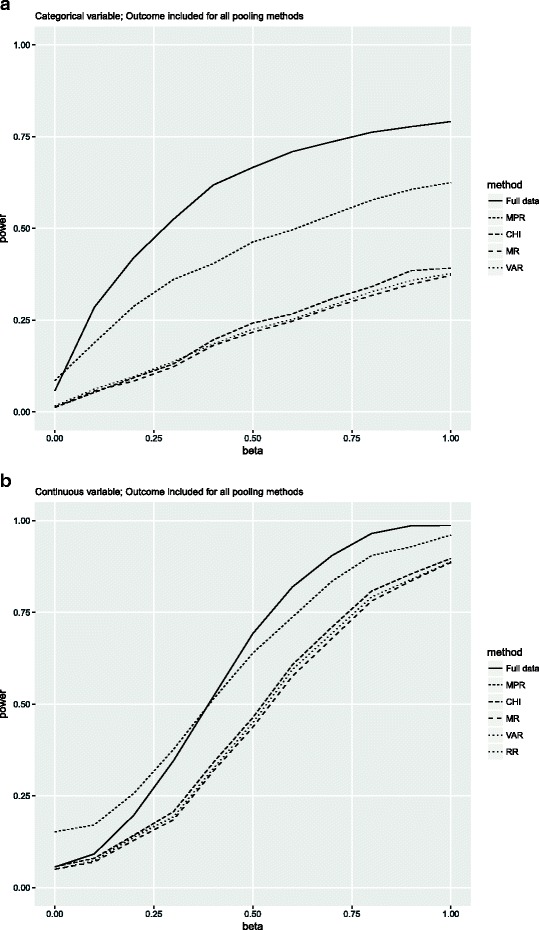
Fig. 1.

Power for the condition where the percentage of missing data was 25% and the correlation between the variables was 0.4 and the outcome was included in the imputation model. Note that for the continuous variable the lines for RR and VAR overlap. Full data = complete data; MPR = median P rule; CHI = chi-square test with multiple degrees of freedom; MR = Meng and Rubin pooling; VAR = pooled sampling variance method; RR = Rubin’s Rules
