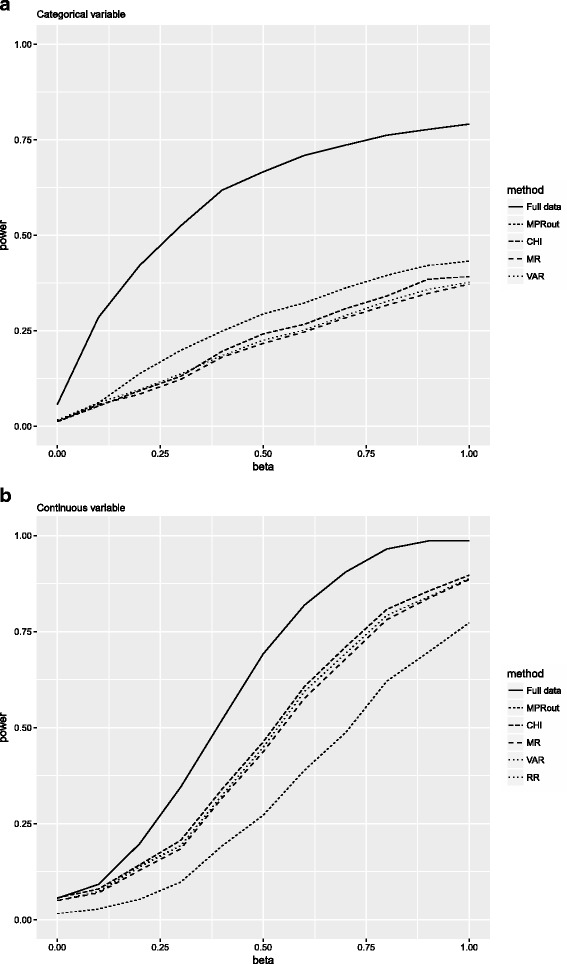
Fig. 3.

Power for the condition where the percentage of missing data was 25% and the correlation between the variables was 0.4. Note that for the continuous variable the lines for RR and VAR overlap. Full data = complete data; MPRout = median P rule with outcome excluded from imputation model; CHI = chi-square test with multiple degrees of freedom; MR = Meng and Rubin pooling; VAR = pooled sampling variance method; RR = Rubin’s Rules
