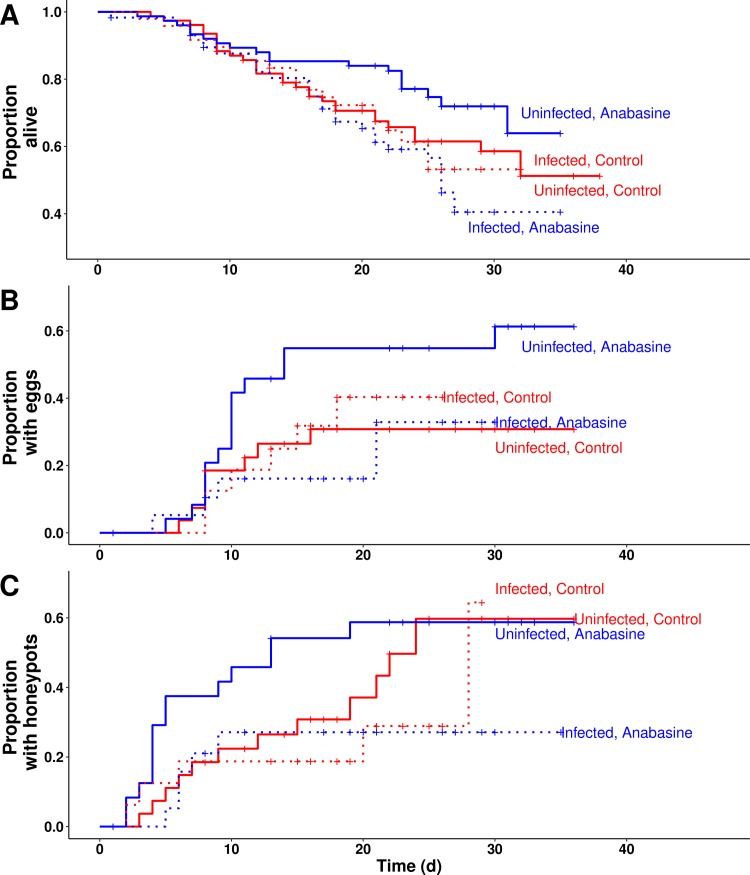
Fig 3. Effects of Crithidia infection on microcolony performance in the Life History Experiment.
Microcolonies were observed daily for (A) deaths, (B) time to first egg production, and (C) time to first honeypot construction. Line type represents infection treatment (solid lines for uninfected microcolonies; dotted lines for infected microcolonies). Line color represents anabasine treatment (red lines for 30% sucrose control; blue lines for 30% sucrose with 5 ppm anabasine). Crosses represent events (i.e., deaths, egg production, or honeypot construction) or censoring due to removal of the microcolony from the experiment.

