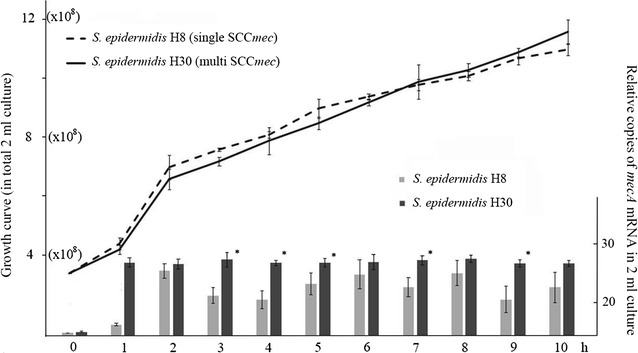
Fig. 2.

Growth curve indicated total cells in a 2-ml culture of S. epidermidis H8, H30 treated with oxacillin at each time point for 10 h (upper left). The corresponding relative total mecA mRNA in 2-ml sample treated with oxacillin at each time point was measured by quantitative RT real-time PCR (lower right). Data were presented as the relative copies of mecA mRNA levels compared with that of S. epidermidis H8 (0 h). Each bar represents the mean ± SD of at least three independent experiments. *P < 0.05 between two strains at each time point
