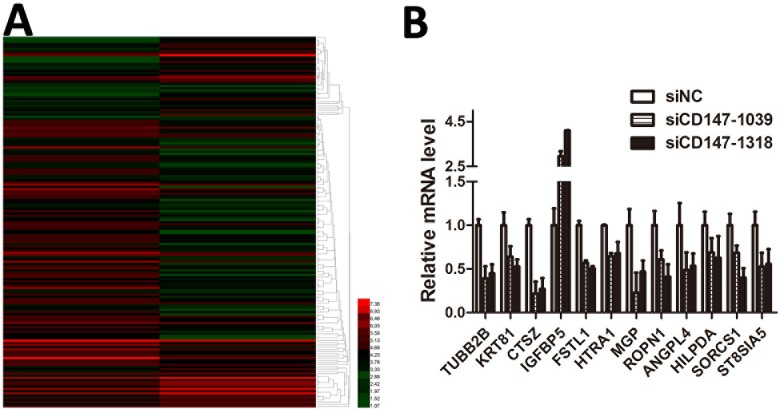
Fig 3. CD147 gene knockdown in A375 cells affected many gene translation pathways, thus leading to the differential expression of hundreds of genes.
(A) Heatmap representing the expression levels of genes; red (normal) and green (siCD147) colors indicate the up- and down-regulated genes. Transcriptome analysis demonstrated 67 up-regulated and 115 down-regulated genes in A375 cells transfected with siCD147. (B) Several genes referred to in A were shown to be up- or down-regulated in A375 cells by RT-PCR The result was consistent with the transcriptome analysis.

