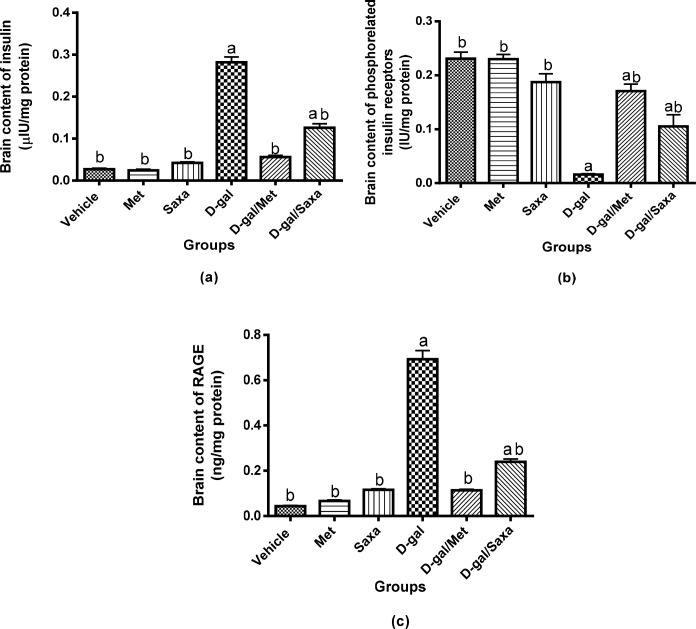
Fig 6. Insulin resistance markers in the brain.
Vehicle, rats treated with distilled water (1.5 ml/kg/day, s.c); Met, rats treated with metformin (500 mg/kg/day, p.o); Saxa, rats treated with saxagliptin (1 mg/kg/day, p.o); D-gal, rats treated with D-galactose (150 mg/kg/day, s.c); D-gal/Met, rats treated with D-galactose and metformin; D-gal/Saxa, rats treated with D-galactose and saxagliptin. Each value represents mean ± S.E; n = 6. a Significantly different from Vehicle group at p < 0.05. b Significantly different from D-gal group at p < 0.05.

