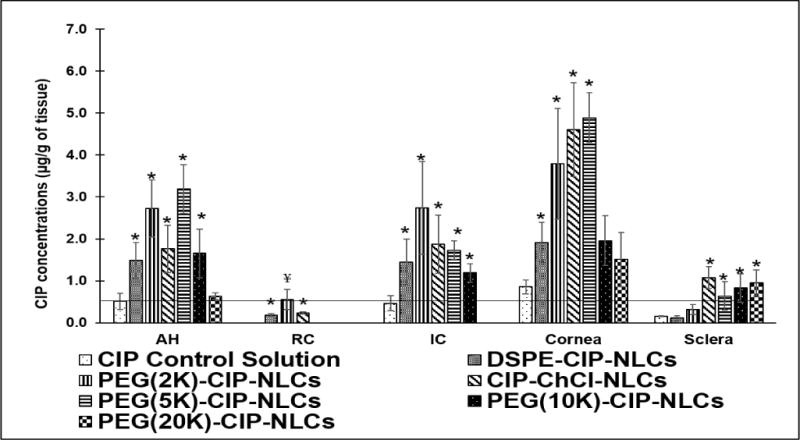
Figure 6.

Ocular tissue concentrations of CIP obtained from CIP Ophthalmic control Solution, DSPE-CIP-NLCs, Chitosan coated DSPE-CIP-NLCs (CIP-ChCl-NLCs) and CIP loaded PEGylated NLCs with different molecular weights of PEGs (DSPE-PEG-2K, DSPE-PEG-5K, DSPE-10K, DSPE-20K) 2 h post topical application (Dose: 300 μg; 100 μL at −30 and 0 min) in a conscious rabbit model. (AH-Aqueous humor, IC-Iris ciliary bodies and RC-Retina choroid). MIC90 of CIP is marked as a horizontal line in the figure. Statistical analysis by One way ANOVA with post-hoc test was performed, where symbol (*) on the ocular tissues represent statistically significant difference of CIP concentrations from different formulations in comparison to control solution. (¥) represents statistically significant difference of retinal concentrations obtained from PEG (2K)-CIP-NLCs compared to all the formulations.
