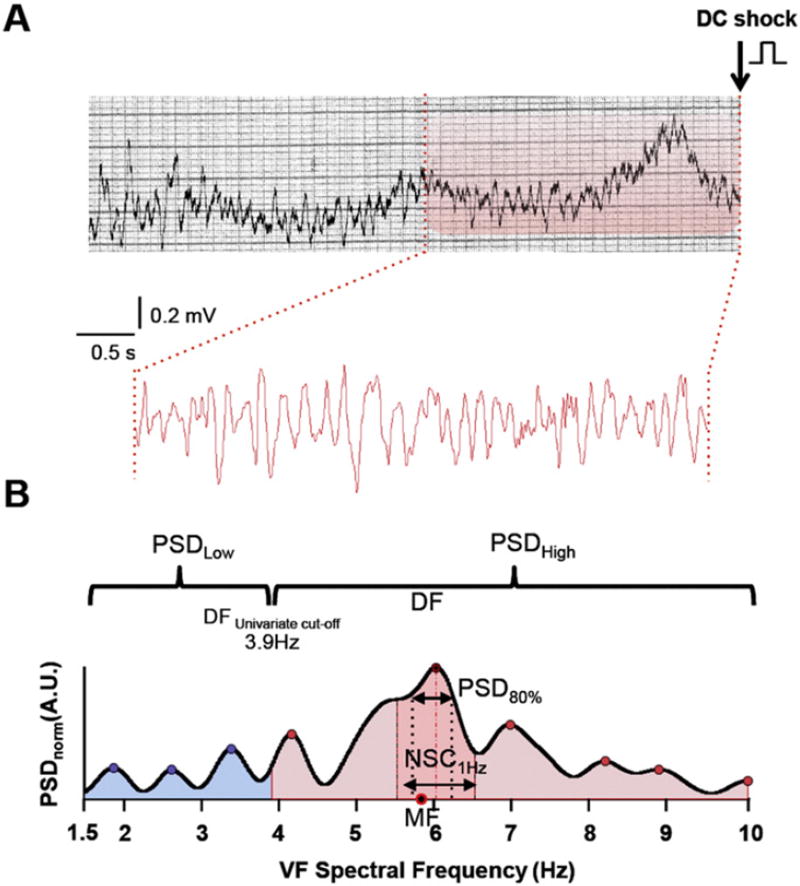
Fig. 1.
Digitization and signal processing of a representative VF trace. A. Upper panel, single lead VF trace from paper ECG prior to the first DC shock. Lower panel, 5-s VF epoch after digitization, segmentation and codification. B. Representative spectra of the VF trace shown in A. DF, MF, 1-Hz DF spectral concentration and PSD80%, are shown. The univariate cut-off at 3.9 Hz was used to define low and high PSD bands. DF = dominant frequency. MF =median frequency. NSC = normalized spectral concentration. PSD = power spectral density.

