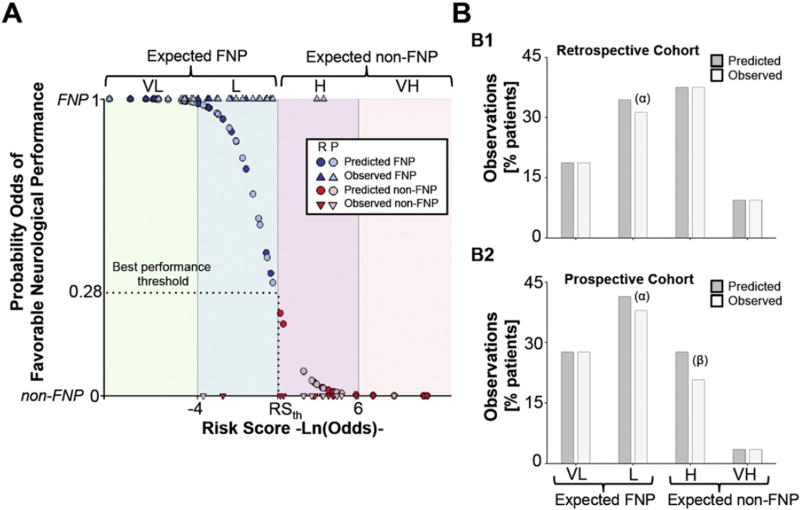
Fig. 4.
Risk score based on the predictive performance of the model. A. Observed (triangles) and predicted (circles) probability of FNP for the entire population. Blue and red represent FNP and non-FNP, respectively (dark fill, retrospective; light fill, prospective).We defined four risk groups of non-FNP performance according to their risk scores as follows: expected FNP; very low (VL) and low risk (L) and expected non-FNP; high (H) and very high risk (VH). B. Percentage of patients (predicted, dark gray and observed, light gray) who belong to each of the risk score groups in both the retrospective (B1) and prospective cohorts (B2). (α) and (β) represent false negative and false positive individuals, respectively. FNP= favorable neurological performance.

