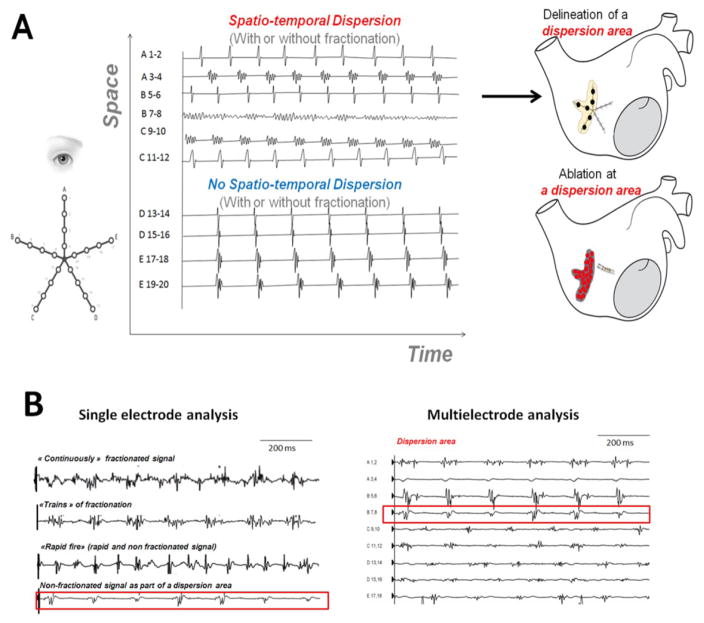
Figure 1. Spatio-temporal Dispersion of Multipolar Electrograms.
Panel A: Dispersion areas: definition, mapping approach and delineation.
Panel B, Left: Examples of single-bipole signals from dispersion regions. Upper: Continuously fractionated and low-voltage signals. Upper Middle: “Trains of Fractionation” are periodic fractionated electrograms. Lower Middle: “Rapid Fires” are short-cycle-length non-fractionated electrograms. Lower: Non-fractionated (>120 ms) electrograms may be one or several of the electrograms within a dispersion region (Panel B, right). Collectively, the bipolar electrograms span most of the AFCL recorded in the region.

