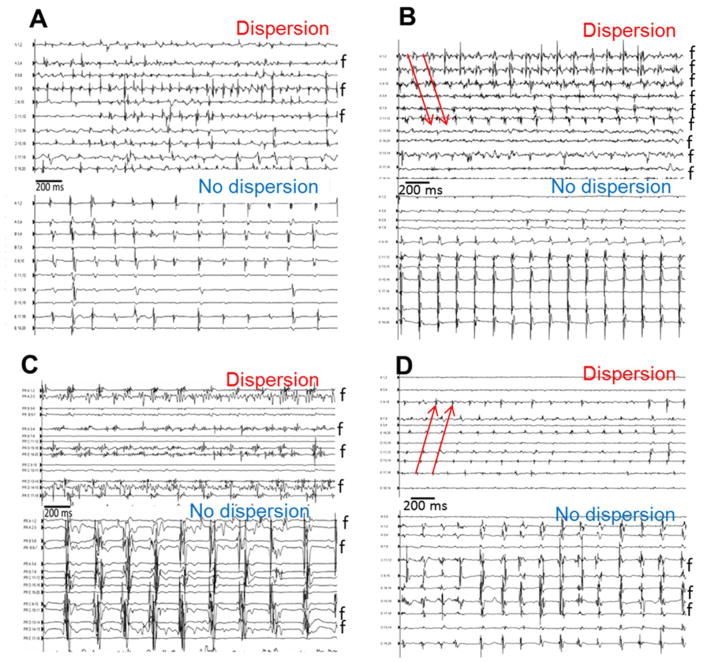
Figure 2. Examples of Spatio-temporal Dispersion.
panels A–D: Representative examples of the multipolar electrograms (clusters of electrograms) recorded in dispersion and in non-dispersion regions in four patients. Fractionated electrograms are marked by an “f”. In the dispersion regions, it was common to find bipoles exhibiting continuously fractionated signal as shown in panels B and C. Red arrows show the sequential activation of consecutive bipoles of multielectrode catheter spanning 100% of the AF cycle length.

