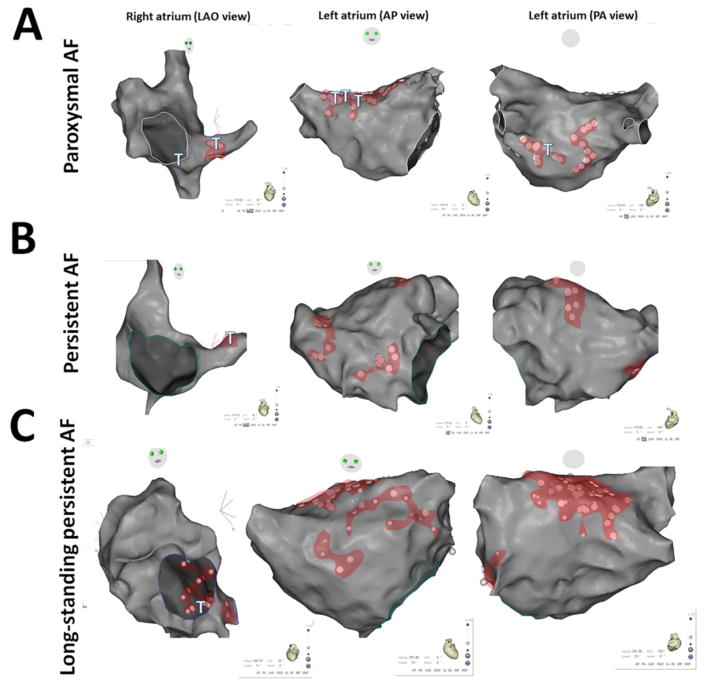
Figure 3. Examples of Dispersion Maps.
Panels A, B, C: Dispersion regions delineated by clusters of electrograms (white dots): localization and extent. CARTO renderings of dispersion regions in representative patients with paroxysmal (panel A), persistent (panel B) and long-standing persistent (panel C) AF. Left: left anterior oblique (LAO) view; middle: antero-posterior (AP) view; right: postero-anterior (PA,) view. Dispersion regions are shaded in red. Sites at which point ablation led to AF termination are depicted with a T.
(AP): antero-posterior
(LAO): left anterior oblique
(PA): postero-anterior

