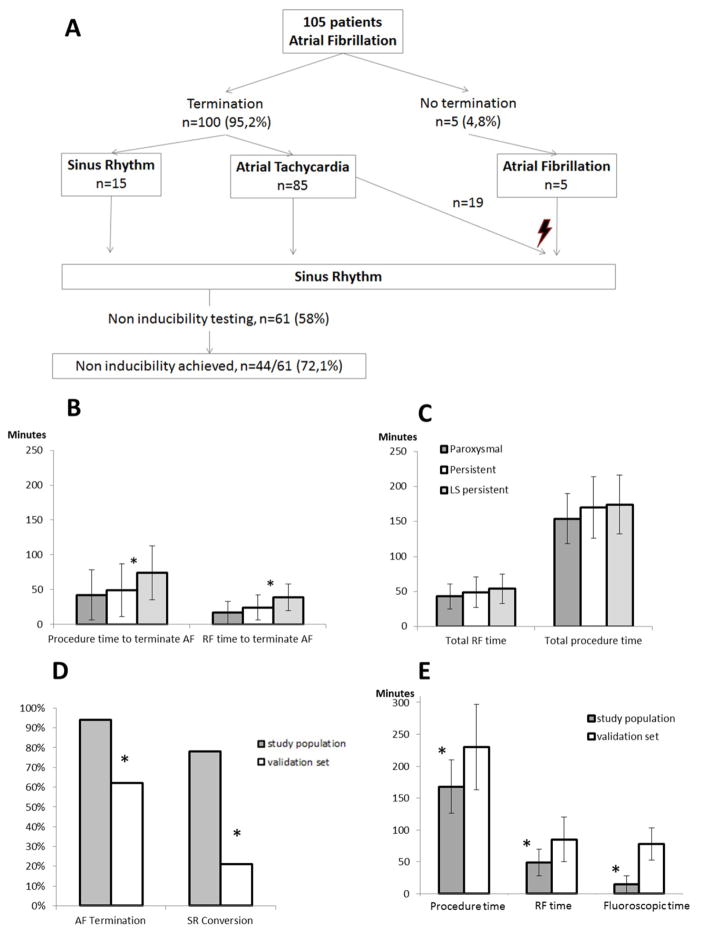
Figure 4. Procedural Outcomes.
Panel A: Flow-chart depicting the per-procedural outcome.
Panel B: Procedure (left) and radiofrequency (right, RF) time to terminate AF. *: p<0.01.
Panel C: Procedure (left) and radiofrequency (right, RF) time. P>0.05 between all AF types.
Panel D: AF termination and sinus rhythm (SR) conversion by ablation in the study population compared to the validation set (left, persistent and long-standing persistent lumped together). *: p<0.01.
Panel E: Procedure, radiofrequency (RF) and fluoroscopic times in the study in the study population compared to the validation set. *: p<0.01.
(RF): radiofrequency

