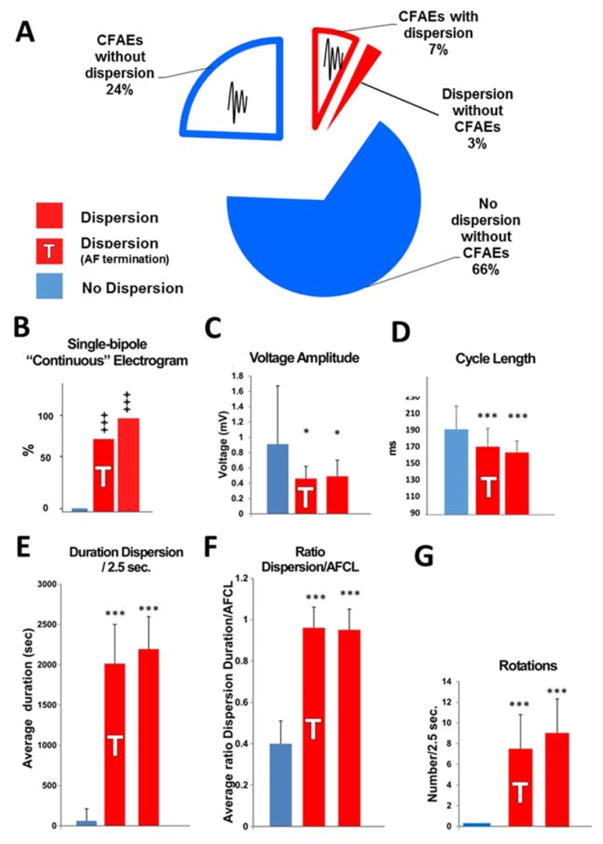
Figure 6. Signal Analysis.
Panel A: Pie chart of the surface area of fractionated electrograms tagged with the CARTO algorithm (auto-CFAEs) in dispersion (red) and non-dispersion (blue) regions. CFAEs: complex fractionated atrial electrograms.
Panels B–G: Off-line analysis of electrograms from dispersion areas and from non-dispersed regions; comparison between dispersion areas (red), dispersion areas at which AF terminated (red, shaded T) and non-dispersed regions (blue). Panel E: Cycle length. Panel F: Voltage amplitude Panel G: Rotations. Panel H: Presence of continuous CFAEs. Panel I: Duration spatio-temporal dispersion/2.5 sec. Panel J: Ratio spatio-temporal dispersion/AFCL. Mean + SE; *: p<0.05; ***: P<0.01; +++ p: <0.05 (Kruskal-Wallis), n = 20 patients; n = 68 and n = 35 dispersion areas and non-dispersed regions, respectively.

