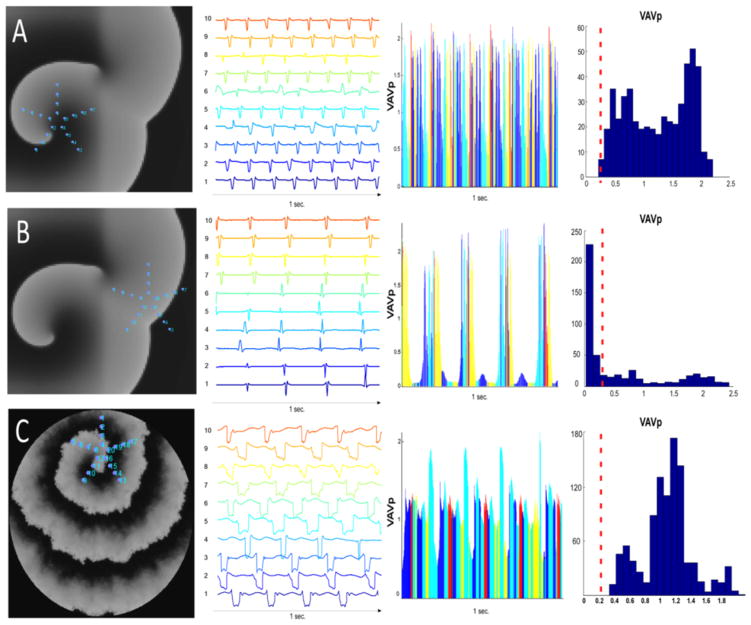
Figure 7. Numerical Simulations.
Panel A: Human atrial model, homogeneous substrate: the virtual PentaRay is positioned at the center of the driver. The aspect of the pseudo-multipolar electrograms is one of spatio-temporal dispersion, reminiscent of patients’ dispersion areas. Panel B: Human atrial model, homogeneous substrate: The virtual PentaRay is positioned at the periphery of the driver in a region activated at a slow frequency of excitation. Panel C: Interstitial fibrosis condition (myocyte-myofibroblast ratio: 0.5). The pseudo-multipolar electrograms exhibit a large spatio-temporal dispersion. See also supplemental movies 1 and 2. The VAVmax amongst the 10 pseudo-bipoles of the virtual Pentarray was collected at each time point to form a new time-series VAVp. Histograms of the distribution of VAVp values are presented in bins of 0.1 mV. Low VaVp values are underrepresented in the driver regions while they are predominant in bystander regions (red dashed line).

