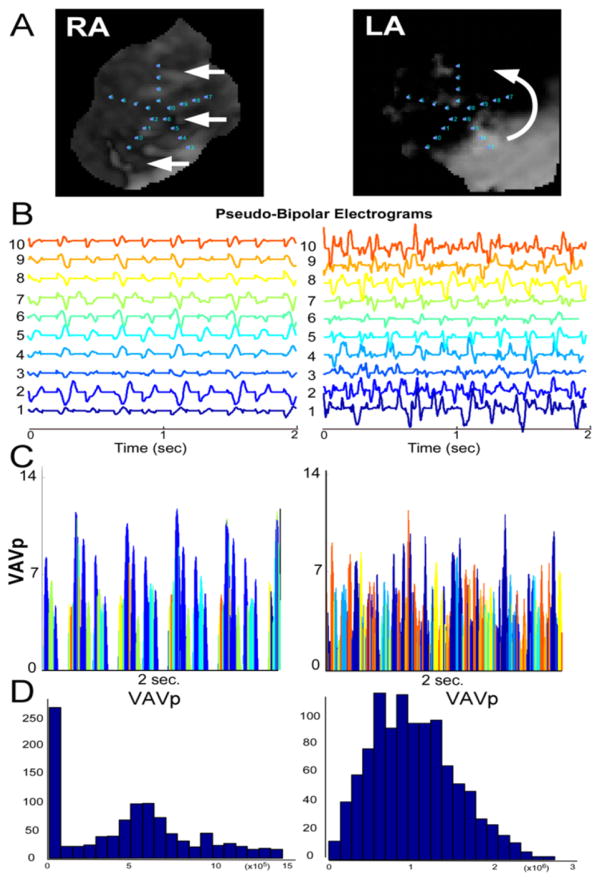
Figure 8. Optical Mapping.
Pseudo-multipolar single-pixel time series obtained from an optical mapping experiment in a left--atrial-scar heart. In the RA, planar-like waves yield little tempo-spatial dispersion (RA, left panels). In regards of a LA driver (right panels), however, aspects reminiscent of patients’ spatio-temporal dispersion are seen (see also supplemental movie 2). Panel A: Optical movie snapshots during AF. Panel B: Pseudo-bipolar electrograms. Panel C: VAVp time series. Panel D: Histograms of the distribution of VAVp values. VAVp: see legend of Figure 7. Low VaVp values are underrepresented in the driver region (LA) while they are predominant in the RA bystander region.

