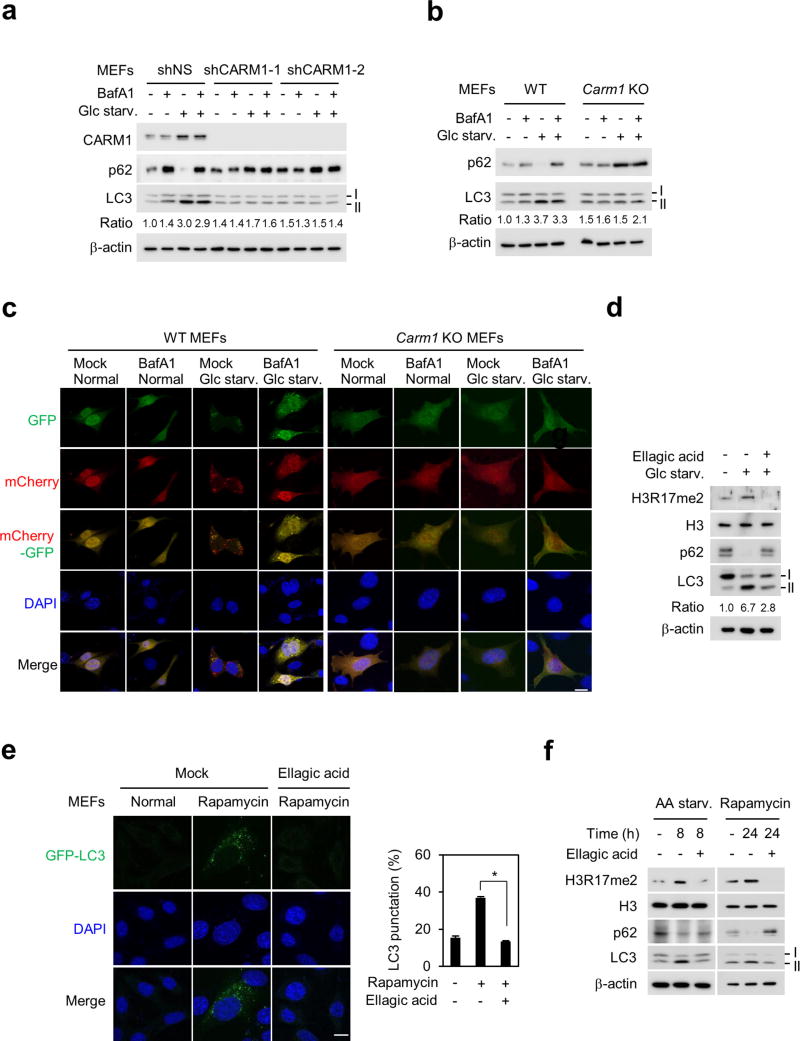
Extended Data Figure 2. Loss of CARM1 and inhibition of H3R17me2 impair autophagy.
a, LC3 flux was analysed in MEFs infected with nonspecific shRNA (shNS) or CARM1 shRNAs (shCARM1-1 and-2). Bafilomycin A1 (BafA1; 200 nM, 2 h). The LC3-II/LC3-I ratio is indicated. b, LC3 flux was analysed in wild-type and Carm1 knockout MEFs in the absence or presence of Bafilomycin A1. The LC3-II/LC3-I ratio is indicated. c, mCherry-GFP–LC3 was transfected in wild-type and Carm1 knockout MEFs and the formation of autophagosome (mCherry-positive; GFP-positive) and autolysosome (mCherry-positive; GFP-negative) was examined. Scale bar, 20 µm. d, Immunoblot analysis in MEFs. e, Representative confocal images of GFP–LC3 puncta formation. Scale bar, 10 µm. Bars, mean ± s.e.m.; n = 5, over 150 cells. *P < 0.05 (one-tailed t-test). f, Immunoblot analysis in MEFs.

