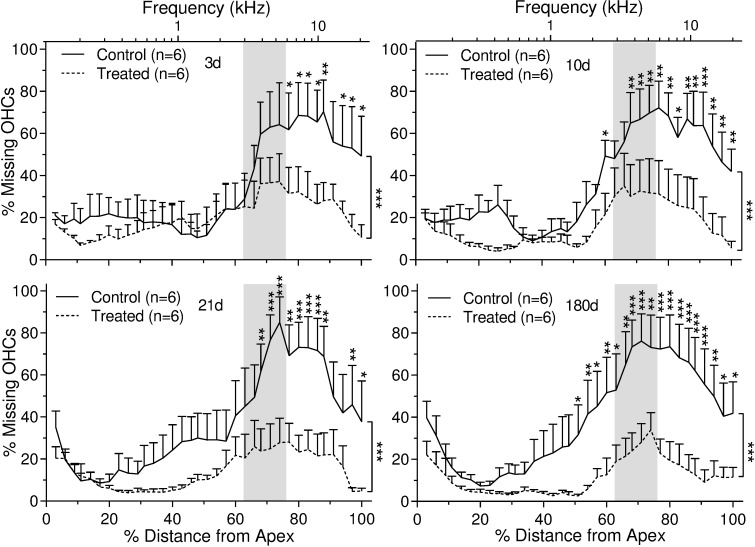
Fig 9. Percent of outer hair cell (OHC) loss as a function of percent distance (and frequency-specific tonotopic position) from the OC apex in untreated and HPN-07-treated chinchilla at 3 days (d), 10 d, 21 d, and 180 d after noise exposure.
The data are plotted as mean ± SEM and “n” represents the number of cochleae. Vertical lines at right of figures show a significant difference of mean values for noise only "Control" and Treated" groups as determined by two- way ANOVA followed by Bonferroni post-tests: *, p < 0.05; **p < 0.01; ***p < 0.001. Shaded area demarcates the range of noise exposure centered at 4 kHz. Significantly less OHC loss was observed in the basal turn of the OC in the HPN-07 "Treated" group (p < 0.05, 0.01 or 0.001).

