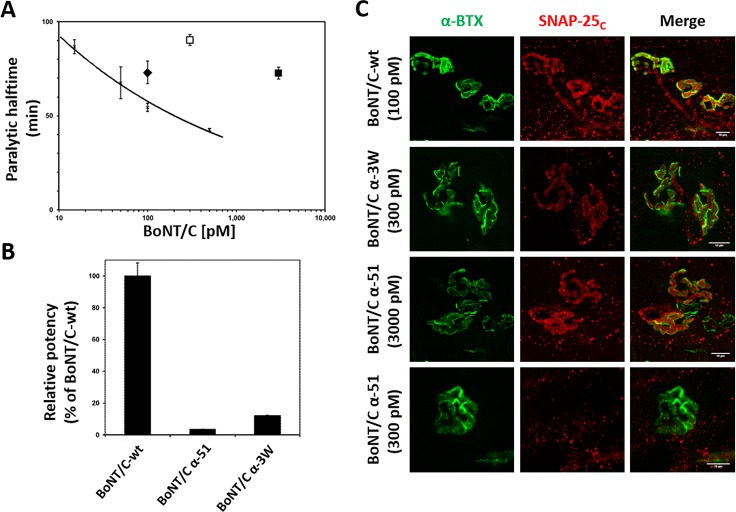
Fig 3. BoNT/C mutants display noticeable lower potency than wild type BoNT/C.
(A) Activity of BoNT/C variants at the MPN hemidiaphragm assay. The black trace represents a dose-response calibration curve reporting the T50 value obtained at indicated bath concentration of a reference wild type BoNT/C [45]. Recombinant BoNT/C-wt (black diamond), tested at 100 pM displays a T50 comparable to the previous BoNT/C-wt used at the same concentration. BoNT/C α-3W (white square) and BoNT/C α-51 (black square) need much higher concentrations to achieve a T50 within the calibration curve. Error bars represent SD of n = 3–4 technical replicates. (B) Calculation of potency of BoNT/C mutants employing a power function fitted to the dose-response calibration curve in A. (C) Immunofluorescent analysis of hemidiaphragms derived from MPN assays. Hemidiaphragms treated with the indicated toxin and concentration were fixed immediately upon completion of paralysis and stained for cleaved SNAP-25 (SNAP-25c, red). NMJs were spotted with α-Bungarotoxin (α-BTX, in green). Images shown are representative of at least three independent experiments. Scale bar, 10 μm.

