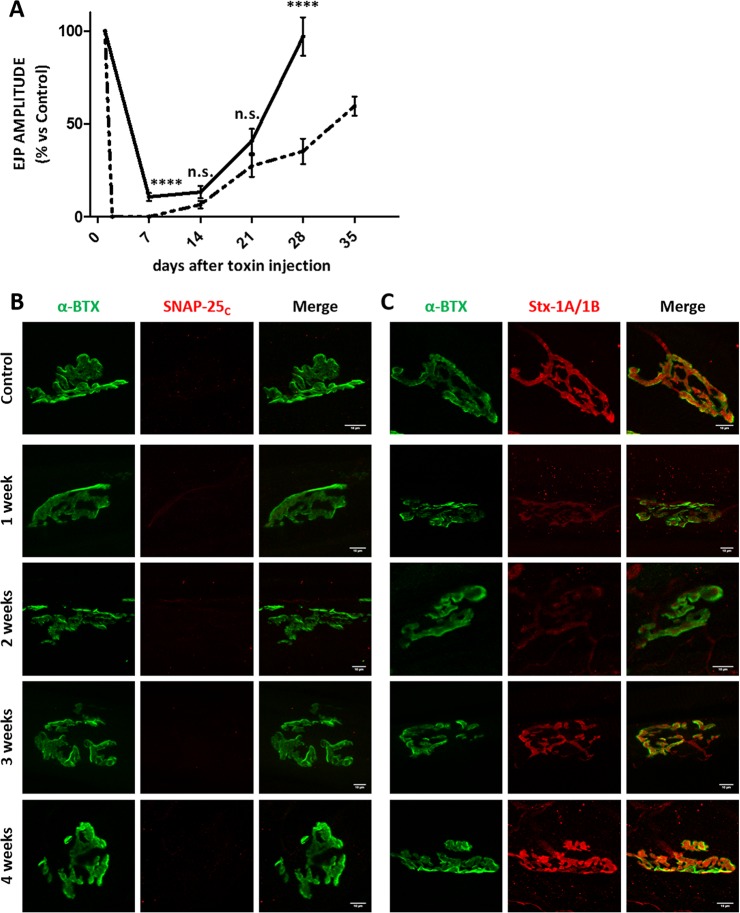
Fig 9. Time course of neurotransmission recovery in soleus muscles upon a local injection of a low dose of BoNT/C α-51.
(A) The black trace shows the analysis of evoked post synaptic junction potentials (EJP) on soleus muscles injected intramuscularly with 10 ng/kg of BoNT/C α-51. At indicated time points soleus muscles were collected and processed for the electrophysiological recordings of EJPs, as previously reported [27]. Data are presented as a percentage of EJPs of control muscles. Each point represents an average EJP amplitude obtained from at least 45 muscle fibers from three different mice per condition. Error bars represent SEM. As a comparison, dotted trace shows the time course of EJP recovery obtained with 1 LD50 of BoNT/C α-51. Statistical significance at each time point was determined by a Student's t-test comparing the mean values (**** p<0.0001, n.s. not significant). Error bars represent SEM. (B and C) Soleus muscles coming from the EJP analyses were fixed and stained for (B) cleaved SNAP-25 (SNAP-25c) or (C) Syntaxin-1A/1B (Stx-1A/1B), both shown in red. NMJ were spotted with α-Bungarotoxin (α-BTX, in green). The first row of panels represents the staining of a control muscle.

