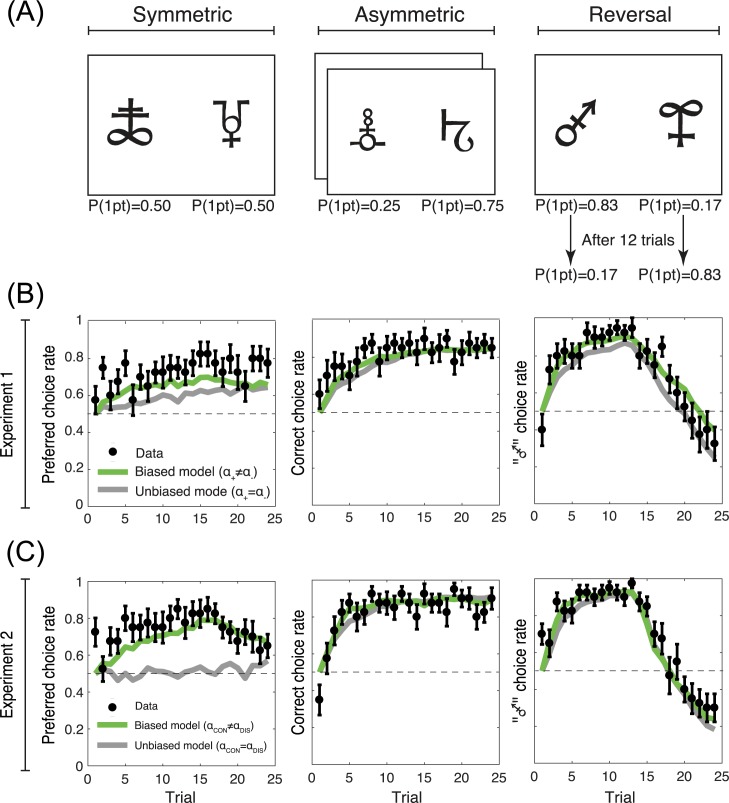
Fig 4. Learning curves and model estimates.
(A) Task conditions. (B) and (C) Learning curves as a function of the task conditions in Experiment 1 and Experiment 2, respectively. Each panel displays the result of the corresponding condition presented in (A). The black dots and the error bars represent the actual data ± s.e.m. The green lines represent the model estimates of the biased models (Experiment 1: ; Experiment 2:αCON≠αDIS), the grey lines represent the model estimates of the unbiased models (Experiment 1: ; Experiment 2: αCON = αDIS).

