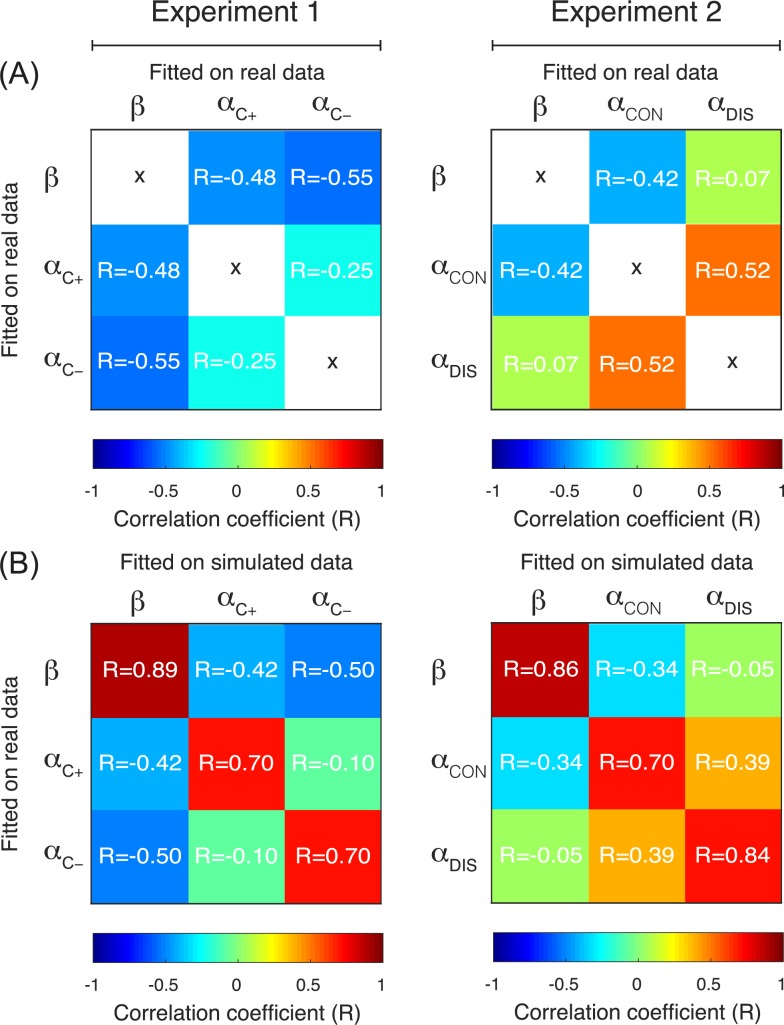
Fig 5. Parameter correlation and recovery.
(A) Correlation matrix of the free parameters for Experiment 1 (left) and Experiment 2 (right). Dark blue or dark red values of R indicate a strong correlation and therefore a problem in parameter identifiability. (B) Correlation matrix of the free parameters used to generate the simulated data (‘Fitted on real data’) and obtained by applying the parameter estimation procedure on the simulated data (‘Fitted on simulated data’). Dark red values of R indicate a strong correlation between the true and the retrieved parameter value and therefore a good parameter recovery.

