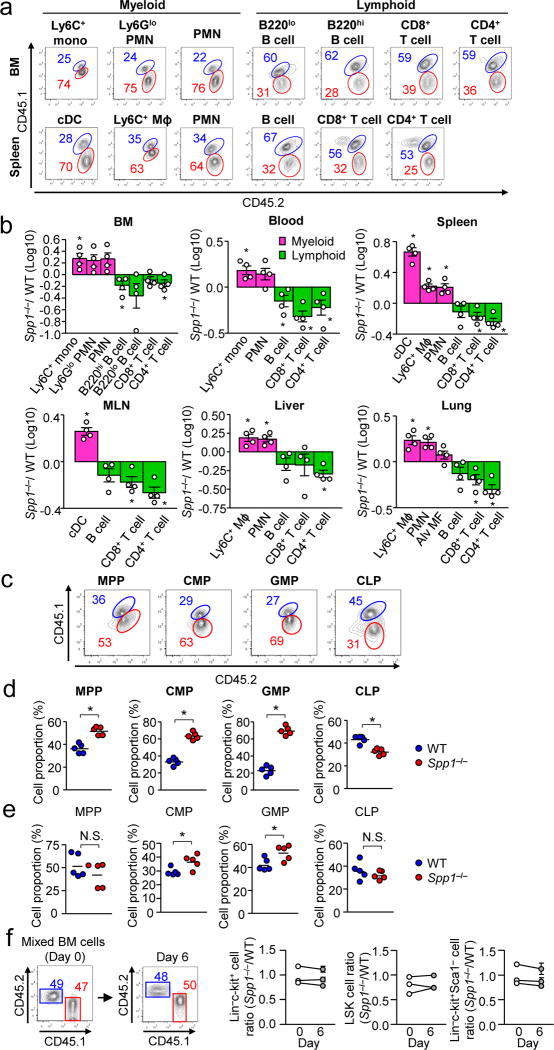
Figure 1. Analysis of cell population in irradiation mix BM chimera mice generated with WT vs. Spp1−/− donor cells.
WT (CD45.1/CD45.2) and Spp1−/− mice (CD45.2) to irradiated WT recipients (CD45.1). (a) Flow cytometry to detect indicated cell populations of WT (labeled with blue) and Spp1−/− (labeled with red) donor origins in the BM and spleens 7-wk after BM cell transfer. (b) Ratios (Spp1−/−/WT) of donor cell numbers in the indicated organs. Mɸ: macrophages. Datasets are representative of two independent experiments. (c, d) Analyzing hematopoietic progenitors in the BM of the mixed BM-chimera mice at 3 weeks after BM transplantation. Representative flow plots (c) and frequencies of WT and Spp1−/− cells in indicated progenitors (d). (e) Instead of total BM cells, LSK cells from WT (CD45.1) and Spp1−/− (CD45.2) were transferred to WT recipients (CD45.1/CD45.2). Ratios of WT and Spp1−/− progenitor cells were assessed by flow cytometry at 3 weeks after transfer. Each dataset is a representative of two independent repeats (5 mice per group)(c–e). (f) Equal numbers of BM cells from naive WT (CD45.2) and Spp1−/− (CD45.1) mice were transferred to irradiated WT recipients (CD45.1/CD45.2). Six days after BM cell transfer, the ratio of WT and Spp1−/− in Lin−c-kit+, LSK (Lin−Sca-1+c-kit+), and Lin−Sca-1+c-kit− cells in the BM was examined. n=3 per each circle on day 6. Data were from three independent experiments. Error bars indicate ± SEM. * p<0.05 (Student’s t-Test).

