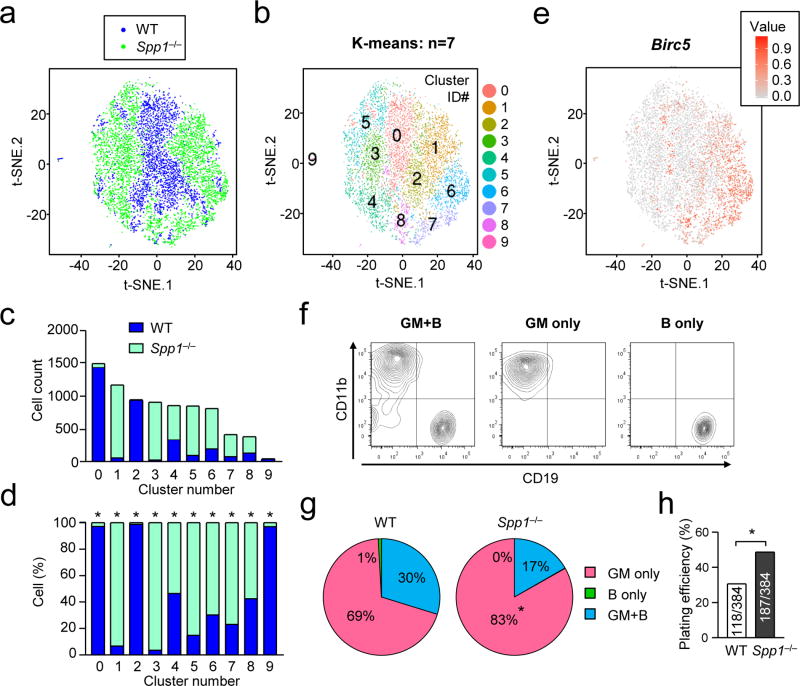
Figure 3. Single cell sequencing and Ex vivo MPP differentiation assay.
(a–f) Single-cell RNA sequencing of MPPs from BMs of WT and Spp1−/− mice 20 hrs after intraperitoneal injection of thioglycollate. Numbers of sequenced MPPs of WT and Spp1−/− are 3,294 and 4,574, respectively. Two sets of data from WT (blue) and Spp1−/− (green) MPPs were normalized by sequencing depth and analysis of batch effects visualized by reduction to 2D by PCA and t-distributed stochastic neighbor embedding (t-SNE) plot (a). The cells in the t-SNE plot in (a) were clustered as K-means of 10 (b). Numbers in (b) denote cluster ID. Numbers of WT and Spp1−/− MPPs in each cluster in (b) are shown in (c). Ratios of WT and Spp1−/− cells in each cluster are shown in (d). Birc5 mRNA expression levels in single cells are indicated (e). (f–h) Ex vivo single-cell MPP differentiation assay. Representative flow plots showing the MPP development to granulocyte-myeloid (GM) and B cells both (“GM+B”, left panel), GM cells (middle), and B cells (right)(f). Percentages of MPPs developed into the indicated cell types (g). Plating efficiency of WT and Spp1−/− MPPs denotes percentages of wells that included proliferated and survived cells at the time of cell harvest (h). Data are representative of two independent experiments. * p<0.05. Data were analyzed by the Chi-squared test (c, d, h).

