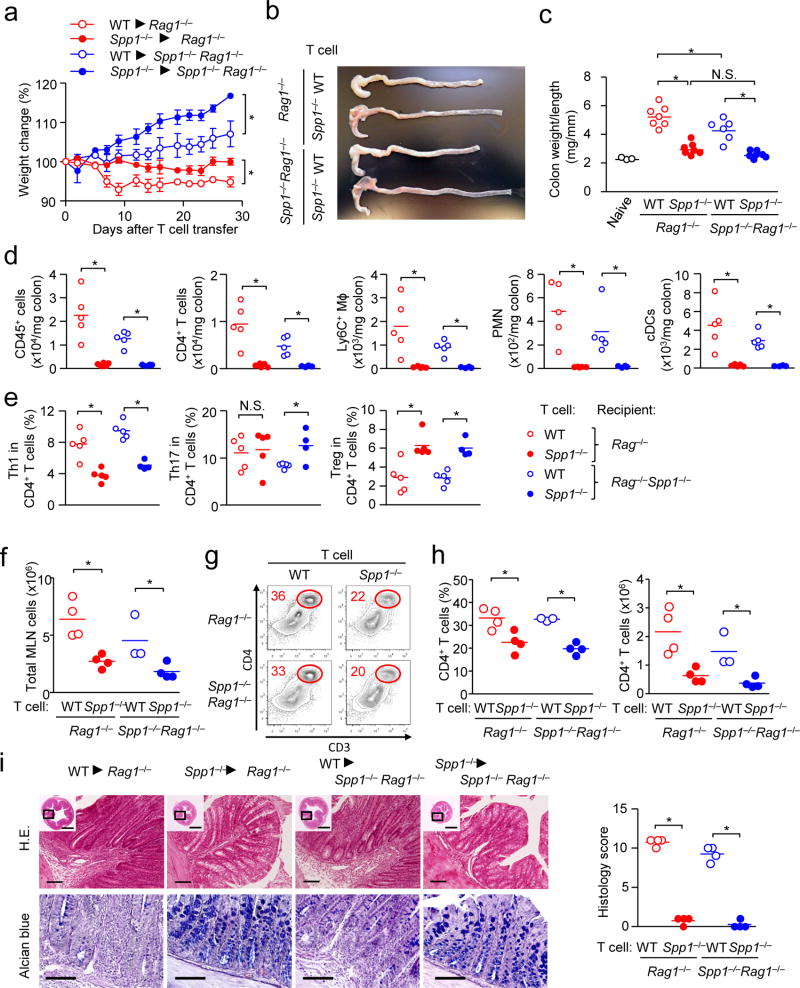
Figure 6. T cell-derived OPN exacerbates T cell-mediated colitis in Rag1−/− mice.
CD62LhiCD4+ T cells (106 per mouse) obtained from WT and Spp1−/− mice were transferred to Rag1−/− or Spp1−/−Rag1−/− recipients. (a–f) Weight change (a)(n=3–4 per group), and a representative image of colons (b) are shown. Colitis severity is shown with the colon weight/length ratios (c), and cell infiltration in the colon (d, e) at 4 weeks after T cell transfer. In (d, e), gating was set as CD4+ T cells (CD3+CD4+), Ly6C+ myeloid cells (CD11b+Ly6C+Ly6G−), neutrophils (CD11b+Ly6G+), cDC (CD11c+B220−), Th1 (CD3+CD4+IFN-γ+), Th17 (CD3+CD4+IL-17+), and Treg (CD3+CD4+Foxp3+). Proportions of the three T helper subsets are relative to total CD4+ T cells. (f–h) Numbers of total MLN cells at 4 weeks after T cell transfer (f), Representative flow panels gated on total leukocytes (g), and frequencies and numbers of CD4+T cells. (i) Histology of colon with histological scores. Scale bars in wide angle and magnified views indicate 1 mm (H&E) or 100 µm (Alcian blue). Datasets in (a–c, f–i) are representatives of successfully repeated three independent experiment. Data in (d, e) was obtained from two independent experiments. Data were analyzed by Student’s t-Test (a, d–f, h, i) and one-way ANOVA (c). * p<0.05. N.S.; not significant.

