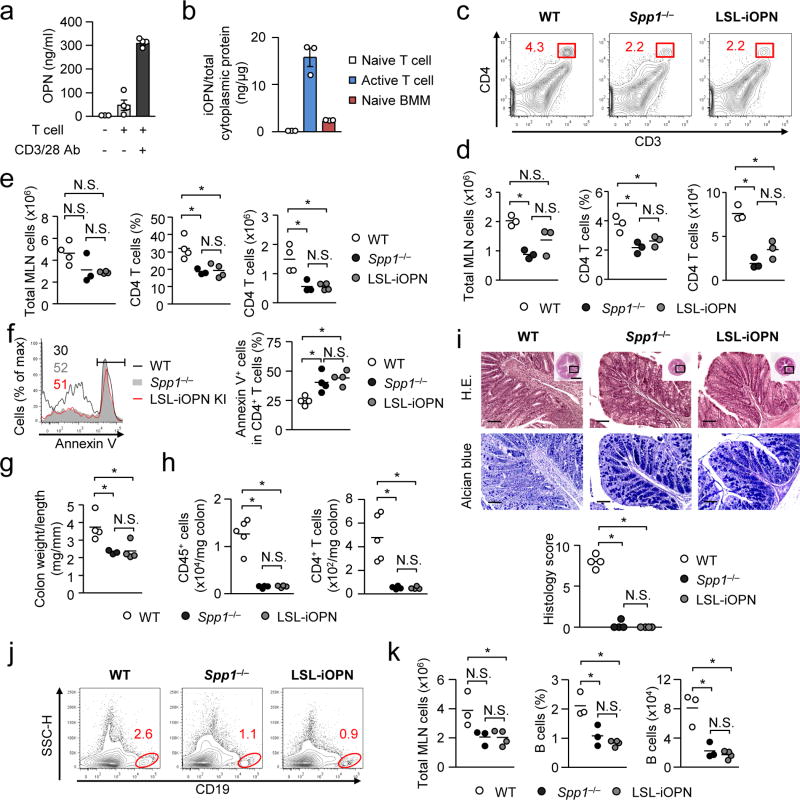
Figure 7. Ruling out iOPN in exacerbating T cell-mediated colitis.
(a) OPN secretion by T stimulated with anti-CD3/CD28 antibody for 3 days in tissue culture. CD4+ T cells obtained from the MLNs of Spp1−/−Rag1−/− mice 4 weeks after CD62LhiCD4+ T cell transfer. Levels of sOPN were evaluated by ELISA. Error bars denote ± SEM. (b) The amount of iOPN per total cytoplasmic proteins in T cells (naive and activated) and BMMs. Cytoplasmic proteins were separated with the Pierce NE-PER reagent. (c–f) Colitis was induced by adoptively transferring WT, Spp1−/− or LSL-iOPN CD62LhiCD4+ T cells to Spp1−/−Rag1−/− recipients. Total MLN and CD4+ T cells (CD3+CD4+ of total leukocytes) were enumerated on day 6 (c, d) and day 28 (e). Apoptotic CD4+ T cells in MLNs on day 3 were labeled with Annexin-V (f). (g–i) Evaluation of the colon on day 28 after T cell transfer. Colon weight per length (g), CD45+ and CD4+ T cell (CD45+CD3+CD4+) numbers (h), and histology with scores (i) are shown. Scale bars indicate 100 µm (main images) or 1 mm (insets). (j, k) Mature B cells (CD19+B220+CD93−) (2×10⁶ per mouse) from WT, Spp1−/− or LSL-iOPN mice were adoptively transferred to Rag1−/− mice. Representative flow plots (j), and the frequencies and numbers of B cells (k) in the MLNs are shown. All datasets are representatives of two independent experiments. N.S.; Not significant. * p< 0.05. Data was analyzed by one-way ANOVA (d–i and k).

