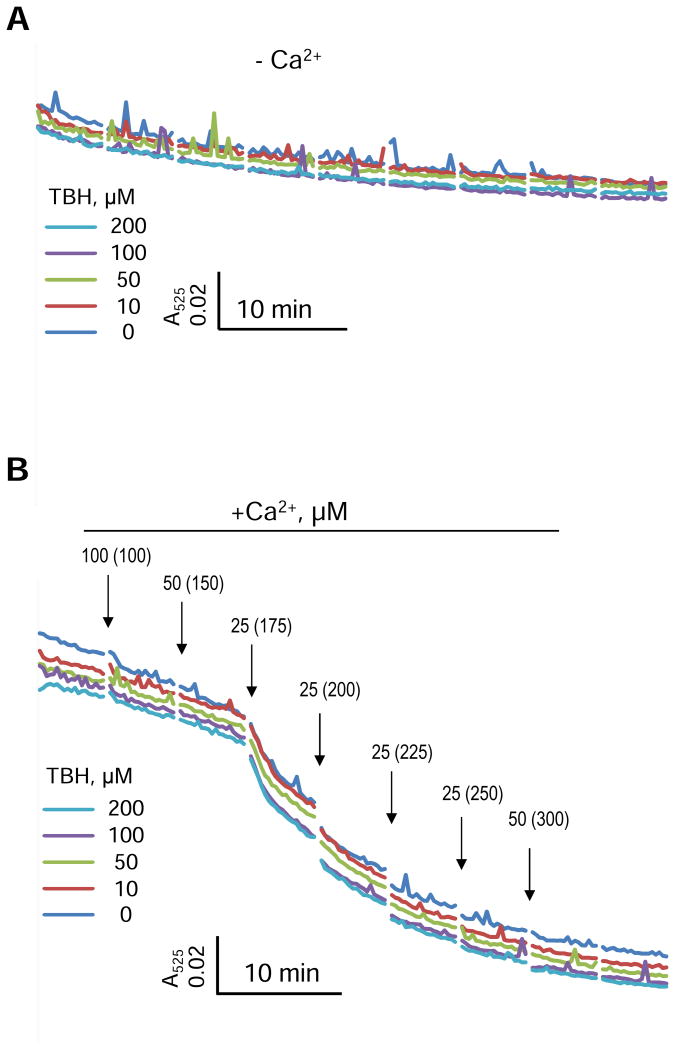
Figure 3.
Swelling of isolated mitochondria induced by TBH in the concentration range of 0-200 μM without (A) or with (B) addition of Ca2+. Each arrow indicates the addition of Ca2+ and final concentrations of Ca2+ for each point are given in brackets. The representative curves with error bars are shown in Supplementary Figure S2.

