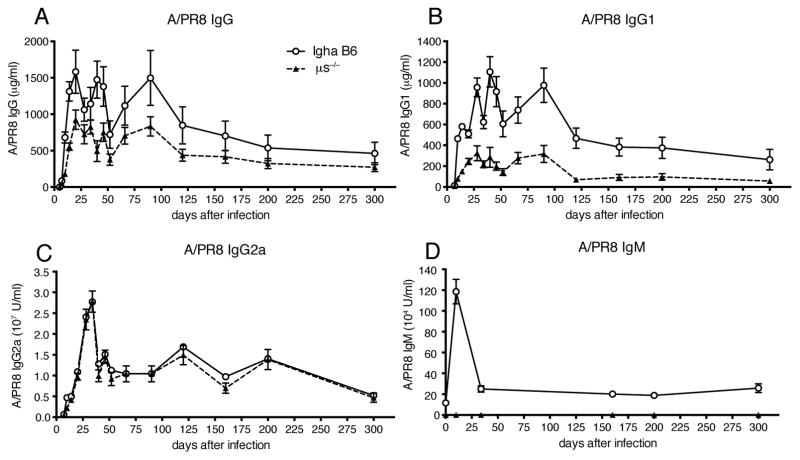
Figure 1. Impaired antiviral IgG responses after influenza virus infection in μs−/− mice.
Graphs show mean concentrations ± SEM of influenza-specific (A) IgG, (B) IgG1, (C) IgG2a, (D) IgM in sera of μs−/− and wild type (WT) mice at indicated times after infection with influenza A/PR8 as assessed by ELISA (n = 5 mice/group). Data are representative of two independent experiments. *p<0.05 A/PR8 specific IgG and IgG1 levels by unpaired two-tailed Student’s t-test.

