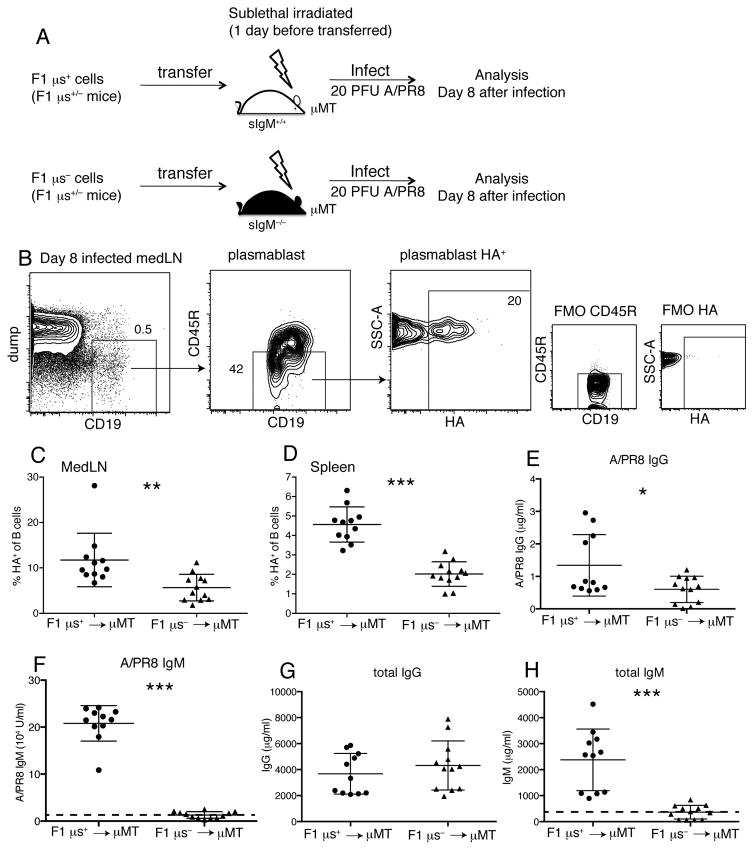
Figure 2. Reduced HA+ specific plasmablast development after influenza infection even when μs−/− B cells develop in an sIgM-sufficient environment.
(A) Sublethally-irradiated μMT mice received i.v either F1 μs+ (WT, IgMb) or F1 μs− (sIgM−/−, IgMa) cells, and were infected with 20PFU A/PR8 one day later. (B) Shown are 5% contour plots with outliers of a representative mediastinal lymph node (MedLN) sample at day 8 after infection. Boxes and arrows indicate gating strategy to identify influenza hemagglutinin (HA)-specific plasmablasts (CD19+CD45RloHA+). Fluorescence minus one (FMO) controls were used to gate on CD45R−HA+ cells. (C/D) Graphs show frequencies of HA+ plasmablasts in (C) MedLN and (D) spleen 8 days after A/PR8 infection. (E/F) Graphs show (E) A/PR8-specific IgG and (F) total IgG in chimera sera on day 8 after A/PR8 infection. (G/H) Graphs show (G) A/PR8-specific IgM and (H) total IgM in the same sera. Dashed lines in Figure 2G, H showed detection limit by ELISA. Data were combined from two independent experiments (n=11–12 mice/group). *p<0.05, **p<0.005, ***p<0.0005 by unpaired two-tailed Student’s t-test

