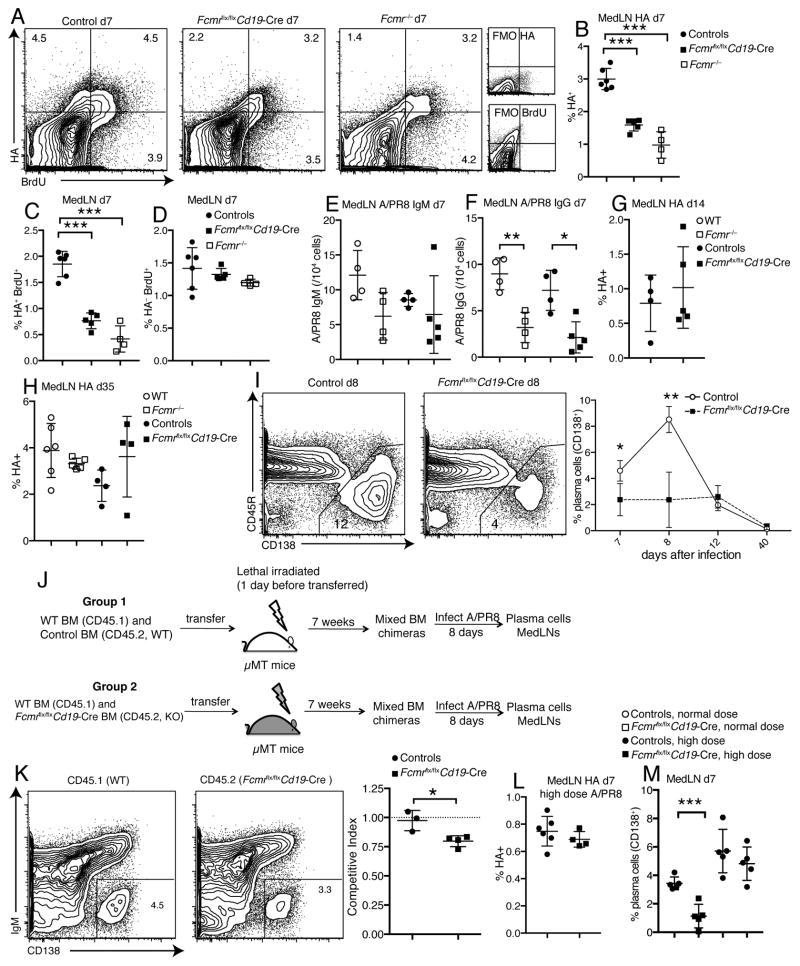
Figure 7. Reduced early plasma cell differentiation in Fcmr flx/flxCd19-Cre mice after influenza virus infection.
(A) Shown are 5% contour plots with outliers gated on live CD19+ B cells to identify BrdU+ HA-specific B cells in medLNs from control, Fcmrflx/flxCd19-Cre and Fcmr−/− mice at day 7 after infection. BrdU was given i.p. 24h earlier. (B) Frequencies of A/PR8 HA-specific B cells in medLNs of WT, Fcmr−/−, Fcmrflx/flxCd19-Cre and control mice at day 7 after A/PR8 infection. (C/D) Frequencies of (C) BrdU+ A/PR8 HA-specific and (D) non-specific B cells in medLNs of WT, Fcmr−/−, Fcmrflx/flxCd19-Cre and control mice at day 7 after infection. (E) A/PR8-specific IgM and (F) IgG-secreting cells in medLNs of WT, Fcmr−/−, Fcmrflx/flxCd19-Cre and control mice at day 7 after infection as measured by ELISPOT (n=4–6 mice/group). (G/H) Frequencies of HA-specific B cells in medLNs at days (G) 14 and (H) 35 after A/PR8 infection (n=4–6 mice/group). (I) Representative 5% contour plots with outliers gated on live CD19+ B cells to identify plasma cells (CD138+) in medLNs from Fcmrflx/flxCd19-Cre and control mice at day 8 after infection (left panel). Graph summarizes mean frequencies ± SD of CD138+ plasma cells (n = 4–5 mice/group for each time point) (right panel). (J) Mixed bone marrow (BM) chimeras were established with 50% WT (CD45.1) and 50% Fcmrflx/flxCd19-Cre (CD45.2) BM; or 50% WT (CD45.1) and 50% control (CD45.2) BM and infected with A/PR8 for 8 days. (K) Shown are 5% contour plots with outliers gated on live CD19+ CD45.1+ (WT) or CD19+ CD45.2+ (Fcmrflx/flxCd19-Cre) cells in the same chimera, identifying plasma cells (IgM−CD138+) (left panel). Graph summarizes the plasma cell competitive index at day 8 after infection (right panel) (n=3–4 mice/group). Competitive index is the ratio of CD138+ cell frequencies of CD45.2 (Fcmrflx/flxCd19-Cre or control) to that of CD45.1 (WT) cells. (L) Frequencies of HA-specific B cells in medLN of Fcmrflx/flxCd19-Cre and control mice after high-dose infection with A/PR8 at day 7 (n=4–5 mice/group). (M) Graph summarizes mean frequencies ± SD of CD138+ plasma cells in medLN of Fcmrflx/flxCd19-Cre and control mice after normal dose and high dose infection with A/PR8 at day 7 (n = 5 mice/group). High dose infection was done with a 5-fold increase in PFU/mouse. *p<0.05, **p<0.005, ***p<0.0005 by unpaired two-tailed Student’s t-test.

