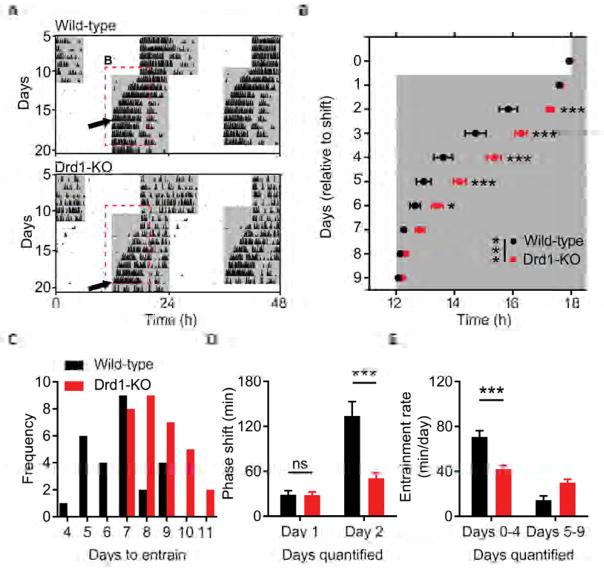
Figure 3. Delayed Entrainment of Behavioral Rhythms in Drd1-KO Mice.
(A) Representative double-plotted actograms of light cycle shift comparing wild-type and Drd1-KO mice. White and grey background indicates the; light and dark phase of the LD cycle respectively. Dotted red lines outline onset data represented in b; black arrows indicate the day of entrainment. (B) Group analysis of activity onset; F (1, 50) = 16.55; p = 0.0002, repeated-measures two-way ANOVA with Bonferroni post hoc comparison; n = 26/group. * p < 0.05, ** p < 0.01, *** p < 0.001. (C) Frequency of mice per number of days required to entrain wheel running activity to the new light cycle. (D) Group analysis of day 1 and day 2 cumulative phase shift; F (1, 50) = 11.83; p = 0.0012, repeated-measures two-way ANOVA with Bonferroni post hoc comparison; n = 26/group. *** p < 0.001. (E) Rate of entrainment calculated by the slope of activity onsets divided into two segments: days 0–4 and days 5–9 relative to the light cycle shift; repeated-measures two-way ANOVA with Bonferroni post hoc comparison, *** p < 0.001. Data are represented as mean ± SEM. See also Figures S2, S3 and Table S1.

